Tektronix supports power measurements from prototyping to failure analysis
The August print issue of EE-Evaluation Engineering includes a special report on power electronics test. In preparation for that article, we asked test equipment vendors to provide information on their products and strategies. Varun Merchant, technical marketing manager; Scott Davidson, product marketing manager for oscilloscopes; and Seshank Malap, applications engineer for power analyzers—all from Tektronix—responded in detail by email. In the following in Q&A format they elaborate on points raised in the print article.
Question: What are some features of Tektronix oscilloscopes that make them suitable for power-electronics test?
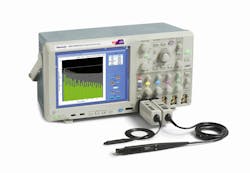
Answer: The MSO/DPO5000B oscilloscopes offer up to 2 GHz in bandwidth and 10 GS/s in sample rate, providing high signal fidelity and advanced analysis capabilities. Features such as segmented memory and visual trigger and search enable users to capture, store, and analyze complex signals with ease.
The MDO4000B mixed-domain oscilloscopes, when paired with the DPO4PWR Power Analysis Software, also offer a complete power measurement solution that is automated and therefore repeatable. The MDO4000 series offers up to 1 GHz in analog bandwidth but includes a spectrum analyzer with frequency coverage up to 6 GHz. This is the only oscilloscope on earth that has a dedicated spectrum analyzer that enables synchronized insights into analog, digital, and frequency-domain signals. So troubleshooting switch-mode power supply noise, for example, becomes easy and saves time. A wide real-time capture bandwidth (of up to 3.75 GHz) makes it possible to view more of the spectrum at once and trigger on RF power levels to isolate noise sources.
At what stage of the design, development, and production process are your products used?
- Component selection: During the component-selection phase, engineers would want to a test discrete component against its specifications to make sure it will work for their application. Instruments like a source measuring unit [SMU] can be very important in characterizing discrete power components.
- Prototyping and debugging: Once the design is frozen and the BOM is set, prototyping comes next. Prototyping is probably the most important phase in in the design cycle, which involves intensive debugging on the analog and digital circuits for the first time. Tektronix oscilloscopes and probes with their sophisticated features for each specific stage give engineers the right tools to combat the complex tasks such as measuring switching component losses, analyzing timing signals, and measuring frequency response.
- System-level test and validation and compliance to standards: Once all the pieces of the puzzle are in sync and working, it’s time to test the system-level specifications. This is the stage where inputs and outputs, including efficiency of the system, are tested to make sure all the required specifications for the design are met. System-level compliance to various standards is also tested at this stage. Highly accurate power analyzers with the right resolution and sampling speeds are important for this stage.
- Production test: Production tests are similar to validation test but less intensive and more data-driven. Precision power analyzers with good data-logging capabilities are instrumental to production test. Production test will make sure the product meets all the desired specifications as it goes out of the door.
- Failure analysis: Failures can occur anywhere in the aforementioned stages, and it’s important that proper analysis is conducted to get to the root cause. Depending on where the failure occurs, appropriate instrumentation should be used as described above to debug the issues. It’s always good to start from a system-level check using a power analyzer to check against specifications and then dig down for clarity. Multimeters can be a great first step towards finding the issue, and then oscilloscopes with appropriate features can be instrumental in narrowing down the root cause.
What types of measurements are your instruments making—for example, I-V or other electrical parameters or thermal or other parameters?
The measurements our instruments make include, but are not limited to, the following ones:
- For component selection and characterization (source measuring units), low resistance measurements, I-V characteristics, transistor current gain (Hfe), and transconductance (gm)
- For prototyping and debugging (oscilloscopes): switching loss (turn-on, turn-off, and conduction losses), safe operating area, magnetic losses (magnetizing power loss and current), maximum magnetic flux density, B-H plots, permeability, automatic deskew, and RDSon.
- For system-level test and validation and compliance to standards (power analyzer): system efficiency; input current harmonics and THD; input power factor and crest factors; true, real, and apparent power; standby power; and compliance test to standards for CE or Energy Star marking.
- For production test (power analyzers): efficiency over time, system power factor and crest factor, input harmonics and power quality to specifications, load and source sweep testing with data logging, energy-consumption testing over time, and system-level parameter data logging for extended periods.
- For failure analysis (power analyzers and oscilloscopes): a combination of all the tests mentioned above.
Do you offer any options (for example, software) that are particularly applicable for power electronics test applications?
Tektronix offers power-analysis software applications for many of its oscilloscopes, including DPOPWR (to be used with the MSO/DPO5000B Series) and DPO4PWR (for the MDO4000B Series). This software allows power-supply designers to configure multiple input and output power and current harmonic measurements with custom-defined settings, measure and analyze power dissipation in switching devices, and measure switching modulation signals in a single acquisition. Built-in degauss and probe deskew features enable accurate and repeatable results.
In addition, DPOPWR provides several magnetic component measurements and the ability to run many measurements in a group to better characterize power supplies. DPOPWR also provides a convenient .mht formatted report that documents the test results with an append feature of previous results.
PWRVIEW software for the PA1000 is a power-analysis suite for Windows PCs that complements and extends the functionality of the PA1000. PWRVIEW enables you to perform the following operations:
- monitor data in real-time from the instrument, including waveforms, harmonic bar charts, and trend plots;
- log, view, and archive data over time from PA1000 power analyzer;
- communicate and remotely control multiple PA1000 power analyzers over USB, Ethernet, or GPIB;
- create formulae for the calculation of power conversion efficiency and other values;
- export measurement data to Excel or .csv format for import into other applications;
- automate instrument setup, data collection, and report generation for key applications with just a few clicks, using wizard-driven interfaces;
- perform compliance testing for standby power per IEC 62301, Edition 2;
- perform precompliance testing for current harmonics per IEC61000-3-2/ 4-7; and
- perform Energy Star and CE marking tests, including energy consumption.
Are there any other unique features about your solutions you would like to emphasize?
Our solutions can make magnetic loss measurements. Magnetic components such as inductors and transformers are used to store energy in power-supply designs. It is essential to characterize these components to determine overall efficiency and stability of power supplies. DPOPWR measures total magnetic loss and inductance and plots B-H relationships easily.
Our solutions also support harmonics measurements. Because a switching power supply presents a nonlinear load to the power line, the input voltage and current waveforms are not identical. Current is drawn for some part of the input cycle, causing the generation of harmonics on the input current waveform. Excessive harmonic energy can affect the operation of other equipment connected to the power line and increase the cost of delivering the electric power. DPOPWR software analyzes up to 100 harmonics.
And finally, our Power Solution Bundle includes a suite of products to perform common power-analysis measurements. It comprises the power analysis software module (DPOPWR), a high voltage differential probe, an AC/DC current probe, and a probe deskew fixture.
Ed. Note: Tektronix also provided links to additional resources:
- Making Standby Power Measurements: http://info.tek.com/www-making-standby-power-measurements.html
- Power Measurements on AC-DC power supplies: http://www.tek.com/document/application-note/power-measurements-ac-dc-power-supplies
- Power Supply Measurement and Analysis with DPOPWR Software: http://www.tek.com/fact-sheet/power-supply-measurement-and-analysis-dpopwr-application-software
- Simplifying DC-DC Converter Characterization: http://www.tek.com/document/application-note/simplifying-dc-dc-converter-characterization-series-2600b-system-sourcemet
- Measuring Switching Loss with an Oscilloscope: http://www.tek.com/document/application-note/measuring-power-supply-switching-loss-oscilloscope
- Tips and Tricks for making Low Power Measurements: http://www.tek.com/document/technical-brief/tips-and-tricks-optimizing-low-power-measurements
- The benefits of low capacitance probes: http://www.tek.com/document/application-note/low-capacitance-probes-minimize-impact-circuit-operation-0
- Tools to boost measurement resolution to more than 11 bits: http://www.tek.com/document/application-note/tools-boost-oscilloscope-measurement-resolution-more-11-bits
- Guide to Power Supply Measurement and Analysis: http://info.tek.com/power-ln-power-primer.html
See also these related articles:
About the Author

Rick Nelson
Contributing Editor
Rick is currently Contributing Technical Editor. He was Executive Editor for EE in 2011-2018. Previously he served on several publications, including EDN and Vision Systems Design, and has received awards for signed editorials from the American Society of Business Publication Editors. He began as a design engineer at General Electric and Litton Industries and earned a BSEE degree from Penn State.

