In Part 1, the basics of the P2 were discussed through easy straightforward simulations in LTSPice. In this article, we delve further into the P2’s design. It hasn’t been easy investigating the nature of the P2, and below I share a realization I had while exploring this old operational amplifier.
“In my quest to understand the P2, I took a journey toward my inner self. Not being able to afford a trip to Kathmandu, I simply meditated in front of the testbench with all instruments turned on. After hours of humming (mostly from the step-down transformers in the power supplies) and pensive silence, I hit an epiphany. My arrogance and narcissism has led me to live a life of self-centeredness. But at the bottom of it all, it wasn’t really all about me; it’s all about the P2. In order to fully grasp the concept of the P2, I must feel the P2, act like the P2, become the P2!
“I rejoiced over my realization. With newfound strength, I set the SMU to ‘Pulse’ mode, held the terminals with both hands, and imagined I was functioning as a comparator. A few moments later, my head started bobbing up and down.”
Note: Before you report the author to a mental institution, please do read the remainder of this article. I believe you may get something useful out of it.
Tomfoolery aside, there are a lot of things I’ve learned about the P2 while messing with it in LTSpice. I don’t regularly use LTSpice because I feel more attuned to the Virtuoso interface (heck, the “F” keys are barely used in its schematic editor). However, I think Multisim GUIs are the most comfortable (my personal adventures aren’t that exacting). Of course, LTSpice is free, so it’s outrageous to expect the GUI to compete against Cadence.
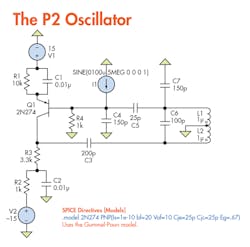
Figure 1 shows the oscillator (redrawn) used by the P2.
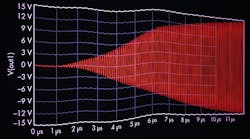
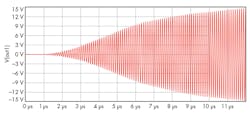
The rails are at 15 V courtesy of the external supplies. A third-party model is defined using a Spice directive, i.e. PNP 2N274. I am unsure of the ac current source’s function, removing it only delayed oscillation. Simulating this region of the circuit yields the waveform in Fig. 2.
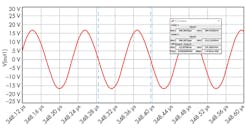
At steady state, the frequency stabilizes to 8.85 MHz (Fig. 3).
Making an Estimation
Is it possible to estimate this frequency without simulation? I know that the tank circuit is providing the oscillation through the flywheel effect, and it will resonate when the capacitive reactance seen on the left side of the circuit equals the inductive reactance seen on the right side; i.e., the loading effect is minimal.
So, 1/(2*pi*f*C) = 2*pi*f*L. Solving for the frequency “f” yields 1/(2*pi*sqrt(L*C). The inductance is simply 1 µH. The capacitance is 150 pF // 21.43 pF // 200 pF. Plugging in the values returns a frequency a little off from expected –8.3 MHz. Maybe there’s a 0.55-MHz discrepancy due to the neglected capacitive load introduced by the other components. At least we have a theoretical estimate.
When C1 is removed, the circuit no longer oscillates. Perhaps without the capacitor, there’s nothing to drive the transistor of Q1. At t=0, the base terminal of Q1 is near ground potential, 37.43 mV. The emitter terminal is at 0.4468 V. Q1’s threshold voltage is 0.75 V, so 0.40937 V isn’t enough to trigger Q1. Therefore, Q1 is off. VCE of Q1 is at 9.3 V. There’s a 4.6-V drop at R3 and a smaller drop of 1.4 V at R2 (since R3 > R2). The rest of the nodes are at ground potential or at high impedance.
Over time, the base voltage will start oscillating (due to a progressive charge/discharge cycle caused by a “push-pull” effect on one side of the capacitor plates) until VBE is enough to saturate Q1 again and again. Consequently, the collector terminal will go from its negative rail up to Q1’s emitter voltage. Hence, the oscillation. Also, at frequencies above 1.6 kHz, the impedance of C1 becomes small, and the 10-kΩ resistor isn’t seen by the 8.85-MHz signal.
Removing C2 increases the amplitude of the signal. At high frequencies, the dc resistance seen at the negative terminal is 3.3 kΩ. Without the capacitor, the resistance will be higher at the upper end of the spectrum, resulting in a higher voltage.
R4 plays a crucial role as well. When the capacitors are discharged, the voltage bleeds through R4. Without R4, there’s no discharge path and the capacitors will retain a permanent offset that will not satisfy the requirement for oscillation.
When C5 is replaced with a short, or when its capacitance exceeds the range from 6 to 40 pF, the waveform becomes distorted/attenuated (does anyone know why?).
Inductors L1 and L2 control the frequency of oscillation. The circuit can oscillate up to an inductance of around 5 mH; oscillation stops beyond that point.
The most interesting component is C6. When the capacitance of C6 is lowered, the amplitude of the oscillation increases and vice versa. But oscillation stops below 25 pF and above 1 µF. So, the gain of the oscillator is controlled by this capacitor. Also, the waveform has a phase shift when C6 is varied.
Hold on a sec. If we connect a shunt variable capacitor to C6, we can create an oscillator with adjustable gain and phase. And we can make that gain and phase shift proportional to an input signal, “modulating” it. Apparently, this is what the P2 did, using a diode bridge as a mixer for the 8.85-MHz sinusoidal output of the oscillator and whatever input you feed to its terminals.
Gee, that was fun! Even though the analysis above isn’t 100% full-proof, we have a firmer grasp on how the P2 works.
Slew Rate
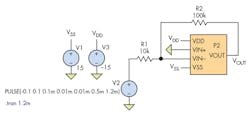
Now it’s time to test the slew-rate response of the P2 (Fig. 4).
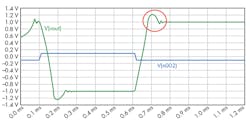
As the rise and fall times of V2 are decreased, the Gibbs phenomenon becomes more pronounced at the output (red circle in Fig. 5). Eventually, no matter the speed of the rise and fall edges, the output will be limited to 0.0282 V/µs.
When the amplitude of the pulse exceeds 1 V, the P2 no longer works as an inverting amplifier. I’m unsure why this happens, but maybe a parameter inside the circuit of the P2 has to be adjusted in order for it to work properly.
I’ve also read a few slew-rate enhancement techniques, like using a slew-rate monitor usw, but whether they will work with the P2 circuit or not is a different story.
So, that’s all for this part of the series. LTSpice and the P2 schematic are both free to the public, so why not give them a try? Please do share any “Eureka!” moments you may have while tinkering with the circuit.
