Over the years, tutorials have appeared in EMC journals explaining how to estimate the power required from a power amplifier intended for use in an RF immunity test system. Little material, if any, has explored the issue of gain compression in RF power amplifiers, especially how a manufacturer specifies the output power of an amplifier and the corresponding pitfalls that may be faced when interpreting a specification sheet for an amplifier.
Although expensive, the RF power amplifier simply is one component in an EMC test system. We only want to put a small RF signal of a certain shape into the input of this component and get a larger one with the same shape at the output.
The output power of the RF power amplifier cannot increase indefinitely. In the extreme, there will be a point where an increase in input power does not produce a discernible increase in output power. At this point, the amplifier is saturated, and by definition, the output is not proportional to the input signal. At the other extreme, with relatively small output power levels, the amplifier is responding to the changes in the input signal and faithfully producing a larger version of the input signal.
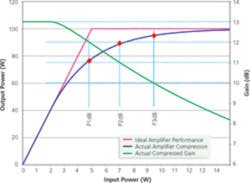
A plot of the power output of an amplifier with an ideal gain compression characteristic is shown in Figure 1. The purple curve representing the ideal output changes abruptly from an area where no gain compression takes place to an area where massive gain compression (saturation) occurs. In terms of system requirements for this component, there is a sudden change from linear (usable) power to saturated (unusable) power.
For simplicity, the input and output power levels shown in Figure 1 relate to the final power stages of the RF amplifier. Earlier stages in the power amplifier boost the input signal level to those shown. In a well-designed amplifier, the output stages go into gain compression well before the earlier stages.
Gain Compression
Gain is the ratio of output power to input power. A close look at the purple curve in Figure 1 shows that the power gain of the amplifier is 20. That is, at any point where the output power is less than 100 W, output power divided by input power equals 20.
In the saturated region, the gain is being compressed more and more as the input power increases, since increasing input power does not produce a corresponding increase in output power.
Only those parts of the input signal that are very large experience gain compression. Most of a large signal will be linearly amplified with only the large peaks affected by reduced gain or saturation.
In a real-world power amplifier, the change from linear power to saturated power is a gentler transition as shown by the blue curve in Figure 1. The defining line between usable and unusable power no longer is clear.
So How Much of the Power Is Usable?
The amount of usable power depends on the application because this dictates how much distortion can be tolerated. A commonly used figure of merit is the 1-dB compression point. This is the output power level at which the gain is compressed by 1 dB. A gain compression of 1 dB equates to approximately a 20% reduction in gain. However, the decreased gain only affects those parts of the signal with amplitudes close to or greater than the 1-dB compression point.
Although not everyone agrees that a 20% reduction in gain is linear, power-amplifier output plots often state linear at P1dB where the P stands for power. Working at the P1dB point may not be appropriate in your application, but the P1dB power level does provide an indication of the capability of an amplifier.
Many system engineers select the required amplifier power by backing off an acceptable amount from P1dB. For example, if an application has a maximum output power of 50 W, the system designer may select an amplifier with a P1dB of 100 W or higher to ensure the amplifier is within its linear region of operation. This choice depends upon the linearity requirement of the system.
Figure 1 shows the P1dB power level with a 20% gain reduction, the P2dB point where the gain is compressed by 2 dB and down by approximately 36%, and the P3dB power where the gain is compressed by 3 dB, down by 50%.
Gain Compression and Output Signal Distortion
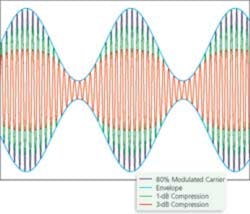
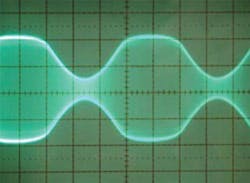
What do these compression points mean in terms of output signal distortion? The dark grey waveform in Figure 2 represents a 1-kHz, 80% amplitude-modulated waveform as used in RF immunity testing. The peaks have instantaneous power levels that are 3.2 times greater than the average power. The red waveform shows what happens if the amplifier is operated with an input corresponding to 3-dB gain compression. The green waveform indicates 1-dB compression.
Oddly enough, the term linear at P3dB has crept into the world of RF amplifiers. If linear at P1dB raises some objections in the RF engineering community, you can imagine the effect that linear at
3 dB has.
Acceptable Distortion
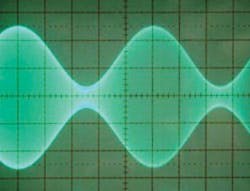
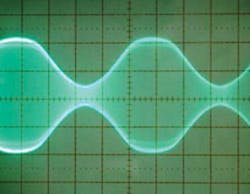
Running an amplifier into compression causes unwanted harmonics to appear at the output. The EMC standards stipulate the maximum permitted harmonic levels, which usually are 15 dB down from the carrier level. Running an amplifier at P1dB normally gives harmonics 20 dB lower than the carrier. So for RF immunity testing, ensuring that the peak power does not exceed the P1dB rating of the amplifier is good practice. Figures 3 a, b, and c are actual screen photos of RF amplifier waveforms.
Figure 3a. Input Waveform
Figure 3b. 1-dB Compressed Output Waveform
Figure 3c. 3-dB Compressed Output Waveform
How Manufacturers Rate RF Power Amplifiers
Manufacturers will guarantee minimum power levels for their amplifiers. This guaranteed minimum applies to all parts of the stated frequency band. Most guarantee the P1dB power, the Psat saturated power, or both. Sometimes you will see “typical” specified on a data sheet. This qualification allows the output power to be a minimum level over the vast majority of the band with dips in just a few areas.
By specifying a typical value, the amplifier manufacturer has a means of contending with production spread. The amplifier is built with RF power transistors that vary in performance, often from batch to batch. The transistor supplier only will guarantee a certain minimum power gain although production devices often display far better performance than the stated minimum.
Be wary of buying an amplifier on the basis of typical performance. Always check the specification sheet for guaranteed minimums. Even if the delivered amplifier just meets these minimums, you can’t send it back.
The MOSFET devices used in modern broadband amplifiers have tremendous power gain at lower frequencies with the gain dropping by as much as 3 dB (half) at the highest frequency. This characteristic causes issues for the amplifier manufacturer, particularly the power rating of the amplifier output circuits.
An output circuit may cope well with the power level at the higher frequencies but fail at the higher power levels of the lower frequencies. The dilemma facing the manufacturer is whether to design in more expensive output circuits that can cope with double the power or to limit the output power by using a relatively low-cost power limiter. In fact, it is possible that the use of a limiter in MOSFET power amplifiers is the origin of the term linear at 3-dB compression.
There is a vast difference between the P1dB and saturated power levels of MOSFET power amplifiers. A MOSFET amplifier with a P1dB power of 500 W will have a saturated power of approximately 800 W. If an amplifier performance plot is shown in watts, there is a massive gap between the plots of P1dB and Psat, such as between usable and unusable power. To avoid this the output power may be artificially limited.
The P1dB and P3dB power levels will appear to be closer together, and the extra cost of higher power output circuits will be unnecessary. Look for the characteristic flattop shape in the power curves of MOSFET power amplifiers whose manufacturers use this method.
There is a disadvantage to the customer with this approach: Were it not for the limiter, high levels of P1dB would be available in the lower part of the band. If the higher P1dB is needed only in the lower part of the band due to the gain characteristic of an EMC antenna, the customer is forced to buy a higher power amplifier, often at double the price.
About the Author
Thomas Mullineaux has designed RF and microwave power amplifiers and subsystems for 15 years. He holds a B.Eng. in electrical and electronic engineering from Portsmouth University, England. Empower RF Systems, 316 W. Florence Ave., Inglewood, CA 90301, 310-412-8100, e-mail: [email protected]
Return to EE Home Page
Published by EE-Evaluation Engineering
All contents © 2004 Nelson Publishing Inc.
No reprint, distribution, or reuse in any medium is permitted
without the express written consent of the publisher.
February 2004

