Only completely defined performance specifications are helpful when comparing products.
Audio signals are judged good or bad by the way they sound, not by their rise time, pulse width, or voltage level. And to complicate matters, what we humans think we hear is a complex mix of physiology�how our ears are made�and psychoacoustics�how we perceive sounds.
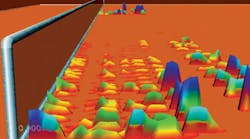
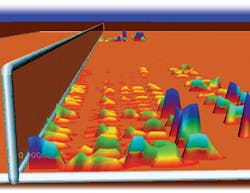
Time-Varying SpectraCourtesy of the Center for New Music and Audio Technologies at UC Berkeley
For these reasons, signal sources used to test the various components of audio systems must meet stringent specifications. Especially for professional audio equipment, test signals require negligible noise, distortion, and deviation from a constant level.
Typically, we can hear sounds in the frequency range from 20 Hz to 22 kHz although the upper end of the range reduces with age. The phases of the various frequencies we hear are not nearly as important as the phase difference from one ear to the other.
Modern audio reproduction systems that use several speakers positioned ahead and behind a listener can provide the perception of distinct locations for each instrument in an orchestra. In fact, even within one ear, phase differences caused by reflections from the ear lobe help us to distinguish the height of a sound source.
One of the most remarkable aspects of the ear is its 120-dB dynamic range. Because the loudness of a sound is sensed logarithmically, scaling in decibels is a natural way of expressing intensity. We perceive a 10-dB increase as a doubling of a sound�s loudness. Expressed as a linear ratio, the dynamic range is 1012. We can hear sounds over an intensity range of 1,000,000,000,000:1 although prolonged exposure above 80 dB will cause permanent hearing damage and pain is felt at 120 dB.
The dynamic range is very large, but it varies with frequency for single tones and is affected by the presence of other tones. For example, the threshold of hearing is lowest at about 3,500 Hz, increasing by orders of magnitude below 100 Hz. As low-frequency sounds become softer, they cannot be heard nearly as well as higher frequency sounds of the same loudness.
The list of audio effects and their complex interactions is long. These factors facilitate the compression of music and speech via formats such as MP3. For example, the perception of a loud sound in the presence of a soft one is the same as that of the loud one alone. The soft sound does not need to be reproduced for a recording to have the same effect as the original with both loud and soft sounds.
On the other hand, the ear is extremely sensitive to very low-level sound and noise, such as during soft music passages and when fading smoothly from one type of program content to another. To satisfy this capability requires exceptionally high resolution in digital sound equipment.
In professional applications, sound is digitized to 24 bits (16,777,216 levels), but it is much more common to find 16-b (65,636 levels) resolution in consumer audio CD products. Analog audio purists have long argued that 16 bits just aren�t enough to faithfully capture the low-level sounds that may be part of the background in a recording of a live performance or simply noise. And they were right.
Depending on exactly how the original 24-b master recording was translated to the 16-b CD format, the reproduced audio could sound lifelike or noticeably different, containing objectionable amounts of low-level granularity noise.
Audio Test Specifications
A large collection of tests has been developed to quantify the performance of audio equipment. Although it�s true that audio is judged by how it sounds, standardized electrical testing makes it possible to compare products objectively before buying them.
Distortion
Several related definitions are grouped under this heading. Total harmonic distortion (THD) determines the rms summation of harmonic output voltages related to a pure input sine wave. Ideally, only the input frequency would be present at the output, so the harmonics represent one type of distortion. THD is the ratio of the rms harmonic voltage to that of the fundamental at the DUT output.
Prism Sound
Measuring THD as it is defined is tedious. Usually, the test performed is THD + noise (THD + N), which compares the output rms value of everything except the fundamental to the level of the fundamental. This means that any hum, buzz, and other noise as well as the harmonics are included in the measurement.
As with all audio tests, the complete test conditions must be stated. For example, if an amplifier is being tested, the list would include the signal frequency, amplifier gain, and signal level. In addition, especially for a digital audio system, the bandwidth of the measurement is important. For digital audio, it must be restricted to 20 kHz. For analog audio, commonly used values are 20 kHz, 30 kHz, and 80 kHz. But regardless of which one is used, it must be included in the test report.
Intermodulation distortion (IMD) is determined by a two-tone test. Two nonharmonically related tones, such as 60 Hz and 7 kHz, are summed and input to the DUT. Nonlinear distortion within the DUT can lead to modulation of one frequency by the other. In this case, sidebands would appear spaced at 60-Hz intervals either side of the 7-kHz signal. The rms summation of these sidebands compared to the upper frequency signal level is defined as IMD.
This test is completely defined by the Society of Motion Picture and Television Engineers (SMPTE). A lab report could simply state SMPTE IM rather than list details such as the +4 dB� 60-Hz and -8 dB� 7-kHz test frequencies and their 12-dB (4:1) mixing ratio.
On the other hand, IMD also has been defined by the International Telecommunications Union (ITU), and this version is identified as IMD (ITU-R). Two equal amplitude tones, spaced 1 kHz apart, are used. However, the signal frequencies and their level are not specified so must be included in a list of test conditions.
The signal-to-noise ratio (S/N or SNR) can be measured by comparing the DUT response to a standardized input signal to the output with no input. A resistor representing the system�s characteristic impedance may be used to terminate the input, or a signal generator set to zero can be connected. Either way, the bandwidth of the noise measurement is critical.
A 20-kHz limit accounts for the ear�s bandwidth but not its frequency-dependent sensitivity. A filter referred to as an A weighting filter can be used to shape the measured noise to more closely correlate with what a listener would hear. Use of this filter in analog audio testing attracts skepticism because it can hide hum and other low-frequency noise. Alternatively, a flat-frequency measurement can be made or the ITU-R 468 weighting filter used to provide better correlation without enhancing low-frequency performance.
For digital audio testing, the A weighting filter is preferred. The delta-sigma analog-to-digital (ADC) and digital-to-analog (DAC) converters commonly used are designed to shift noise energy from the audible band to much higher frequencies. For this reason, the noise measurement bandwidth must be limited to 20 kHz, and the A weighting filter does a good job. Low-frequency noise is not a problem with delta-sigma converters.
The bandwidth or frequency response of a DUT is measured relative to the response at 1 kHz. The same signal level at another frequency should not cause the output to increase from this reference value. The low- and high-frequency points where the response has reduced by 3 dB define the bandwidth. A reduction to the square root of one half, 0.707 or -3 dB, is commonly used, but 0.5 dB may be specified, and even 10-dB is found in loudspeaker data. Both the signal level and the gain reduction criteria must be stated.
Level-Related Tests
The maximum input level is defined relative to a specified amount of output distortion or clipping, typically at a 1-kHz frequency. A THD value of 1% often is used. The signal frequency should be varied through the 20-Hz to 20-kHz range to ensure that the maximum level can be handled at any frequency without exceeding the distortion limit.
A similar test measures the DUT�s maximum output level. The maximum input value as just defined may not be the signal level applied to obtain maximum output. This situation arises if an audio system comprises a number of sections with separate gain controls, for example.
The maximum input is obtained at the lowest first-stage gain and with the following stage gains set low enough that it is the first stage that causes the eventual clipping or distortion. The largest output signal that does not exceed the distortion limit may correspond to a different combination of stage gains.
Audio Precision
Dynamic range is the ratio of the largest output signal to the DUT�s output noise floor. Because the measurement is a ratio, the actual maximum output must be stated before a comparison can be made among competing products. Also, as in other noise measurements, the bandwidth must be limited to 20 kHz and A weighting used only for digital audio systems. All else being equal, a larger dynamic range means that the DUT can reproduce louder or softer sounds or both.1
What�s Different About Digital?
Typically, the digital information on a 16-b CD has been sampled at a 44.1-kHz rate. It must be assumed that an anti-alias filter originally was used to avoid recording any signals above 22.05 kHz. This means that when the CD is replayed, the baseband audio is reproduced without aliasing but with an image of the 20-Hz to 20-kHz signal created starting at 24.1 kHz. A very sharp analog output filter is required to eliminate the image, implying precision components and high cost.
Although you can�t hear frequencies above 22 kHz, the energy in the higher frequency images still can cause distortion. Reducing the image signal to a very low level removes any chance that high-frequency signals can interact with amplifier nonlinearities, for example. The effects being avoided by reducing the image signal amplitude include signal rectification and amplifier saturation with its associated recovery delay. If nonlinear effects were to produce frequencies within the audio band, then these would combine with and distort the intended signals.
Early CD players used expensive analog filters, but these soon were replaced by oversampling digital filters. In this technique, the 44.1-kHz data rate is increased by inserting three, seven, or 15 extra samples for each original one. This kind of interpolation gives rise to the familiar �4, �8, and �16 CD player nomenclature.
There are two reasons that interpolation is done. First, a finite impulse response (FIR) digital filter can provide a linear phase response. One objection to a high-order analog filter is its phase distortion near the band edge, and this problem is avoided by FIR filters. Of course, the FIR filter also overcomes the limited precision and cost associated with the analog filter.
The second reason for higher oversampling ratios is that a digital filter produces an image of itself around the sampling frequency. In the case of �8 oversampling, for example, the sampling frequency is 8 � 44.1 kHz = 352.8 kHz. The 20-Hz to 20-kHz digital filter passband will image as a 20-kHz passband either side of 352.8 kHz from 332.8 kHz to 372.8 kHz.
The digital filter still must be sharp enough to remove the 44.1-kHz CD sampling image energy above 24.1 kHz, but the filter�s own image also must be sufficiently higher in frequency than 20 kHz so a simple external analog filter can suppress it. In the case of �8 oversampling, 332 kHz is more than four octaves above 20 kHz. A low-cost, three-pole low-pass analog filter down 3 dB at approximately 25 kHz would have minimal effect at 20 kHz yet provides 70 dB of attenuation at 332 kHz.2, 3
Test Equipment
What does it take to test 16-b or 24-b digital audio systems? What does good linearity actually mean? When would an analog signal source be more appropriate than a digital one?
These questions don�t have simple answers, although it�s obvious, for example, that the digital information on a 24-b DVD is essentially perfect. Questions about distortion would be better focused on analog amplifiers and loudspeakers than on the digital-to-analog conversion process in a 24-b system.
One of the consequences of working at such high resolution is the miniscule size of a least significant bit (LSB). In the case of a 24-b DAC having a 10-V output, the LSB is equivalent to about 0.6 �V. At this low level, power supply rejection, board layout, thermal drift, thermocouples formed between dissimilar metal conductors, and microphonics all affect fidelity.
Nevertheless, as the number of bits has increased, the analog performance of conversion ICs has improved as well. For example, a 20-b Analog Devices audio DAC in 1991 had a distortion specification of less than 0.0012% compared with 0.002% for a 16-b part. A 24-b differential current-output stereo DAC introduced in 2002 has a worst-case -102.5-dB THD+N rating or 0.00075%. Typically, this IC exhibits THD + N <-110 dB or 0.00032%.
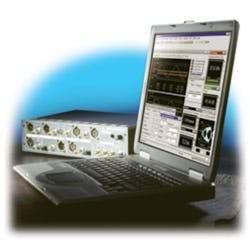
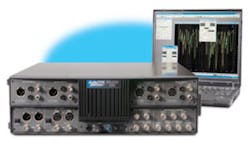
A large selection of 16-b test equipment is available including PC-based versions and traditional stand-alone instruments. Only a few companies claim to have very high-performance audio generators. For example, the dScope Series III from Prism Sound includes an analog signal output that covers the 1-Hz to 83-kHz range. From 20 Hz to 20 kHz, THD + N = -105 dB. The output level is flat within +0.05 dB/-0.1 dB from DC to 22 kHz with a 96-kHz sampling rate. This instrument has an analog output but is fundamentally a comprehensive digital analyzer with signal-generation capability.
The Stanford Research Model DS360 Low-Distortion Function Generator has a 1-mHz to 200-kHz frequency range and claims -100 dB THD from 5 Hz to 20 kHz for a 1-Vrms sine output. The instrument specifications describe the use of a 20-b DAC and direct digital synthesis (DDS) architecture.
In contrast to these generators, the Audio Precision 2700 Series Audio Analyzer features a true analog generator with THD + N <-110.5 dB or 0.0003% + 1 �V. Flatness in this band is within 0.008 dB, typically 0.003 dB. Actual amplitude accuracy is 0.7% at 1 kHz.
Many other specifications could be compared, such as the degree to which the differential outputs are balanced, the quantity and types of test signals available, and cost. As with any attempt to accurately measure electrical performance, skill and considerable experience are required to achieve the last few tenths of a decibel specified by these instruments.
According to Audio Precision, a true analog generator can outperform one based on digital techniques, and the basic THD + N specifications appear to support this view. Proponents of digital generators point to better amplitude and frequency accuracy, and these claims also have validity. However, in terms of what a listener hears, when distortion percentages start with a decimal point followed by three zeros, the analog/digital argument has gone well past being meaningful.
While it�s necessary to use a very good signal source to measure distortion caused by a system component, audio quality is judged by how it sounds, not solely by the fidelity of the DAC output, for example. With this reality in mind, it�s sobering to compare the near-perfection of even low-cost 24-b DVDs and the �3-dB specification of the best professional speaker systems. Until we improve the transducer that converts electrical signals to sound-level pressure variations, the performance of all audio systems, both analog and digital, will be compromised.
Indeed, judging from the number of papers presented at this year�s Audio Engineering Society convention and the workshop session entitled �The Power of Loudspeaker Models,� loudspeaker performance is being widely addressed. Less loudspeaker distortion is necessary before we can truly appreciate just how good modern sound recordings really are.
References
1. Bohn, D., �Audio Specifications,� RaneNote 145, Rane Corp., 2000.
2. Adams, R., �DAC ICs: How Many Bits Is Enough?,� Application Note AN-327, Analog Devices.
3. Gaddy, L. and Kawai, H., �Dynamic Performance Testing of Digital Audio D/A Converters,� Application Bulletin AB-104, Burr-Brown.
FOR MORE INFORMATION
on the Audio Precision 2700 Series
Audio Analyzer
www.rsleads.com/505ee-176
on the Prism Sound dScope Series III
Audio Analyzer
www.rsleads.com/505ee-177
on the Stanford Research DS360
Low-Distortion Function Generator
www.rsleads.com/505ee-178
May 2005
