Spread spectrum clocking (SSC) is used in many computer interfaces such as PCI Express and Serial ATA to improve the EMI performance of the interface. It takes the form of frequency modulation (FM) of the data clock. This has the effect of spreading the radiated energy across more of the frequency spectrum and lowering the power at any one frequency. SSC also reduces the likelihood that your device will interfere with the operation of some other piece of equipment.
For PCI Express and Serial ATA, the level of SSC is specified as 0.5% downspread at 33 kHz with a triangular wave shape. The parameters that describe FM are deviation and rate. In the case of SSC, the rate is 33 kHz, and the deviation is the 0.5% downspread.
For PCI Express, this downspread is 0.5% of 2.5 GHz or 12.5 MHz. FM is symmetric about the carrier, so our FM deviation is one-half of this 12.5 MHz or 6.25 MHz at a center frequency of 2.5 GHz minus 6.25 MHz or 2.49375 GHz.
Using an Oscilloscope
Fundamentally, SSC is changing the period of our data signal. We could measure period jitter with our oscilloscope jitter analysis package. But making a period measurement on a data stream does not work. There are two problems:
� If the data is non return to zero encoded (NRZ), the fundamental period for a 0101 data pattern is one-half the clock period. This will have the effect of doubling the measured deviation of the FM.
� Due to the lack of transitions on every clock cycle, the period measured can be a multiple of the actual period. For example, if we have three zeros in a row, the period measured will be three times the expected value. This does not allow us to see our spreading signal.
To overcome the period measurement problem, use an oscilloscope jitter analysis package with the capability to make unit interval (UI) measurements. The measurement is normalized to one UI of the data stream, eliminating the multiple period problem.
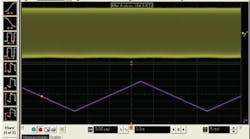
One more step is needed to measure the SSC. Since SSC usually is at low frequency, 33 kHz for PCI Express, we will need to filter our UI measurement. An oscilloscope that implements smoothing can be used to effect a low-pass filter. Now we can see the triangular wave shape of our SSC modulating waveform and measure the frequency and amplitude of the SSC (Figure 1).
Measuring Without a UI
If you don�t have a UI measurement on your oscilloscope, you may be inclined to use a time interval error (TIE) measurement. The TIE, a very common measurement of jitter on data, measures how the edges of the data stream vary in position relative to a reference.
An ideal constant frequency clock serves as our reference; however, it also could be a software-recovered clock. We can measure TIE and plot the measurement result vs. time and see our jitter trend just as we did with the UI measurement.
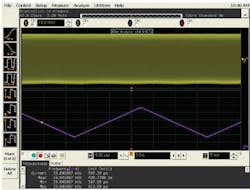
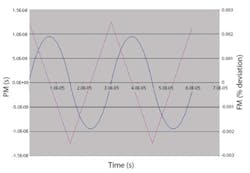
But the trend looks like a sine wave, maybe flattened a bit, not the triangle wave shape we measured with the UI measurement. It is not necessary to have a UI measurement to measure our SSC. We can use our TIE measurement. We need to understand more about FM and how this relates to jitter measurements made with oscilloscopes (Figure 2).
SSC as Jitter
Oscilloscope jitter analysis packages usually measure jitter. When we do FM, we are varying the frequency of our signal and the period and the position of our edges. The varying edge position is jitter. For our purposes, we are defining jitter as timing changes relative to an ideal or constant frequency clock.
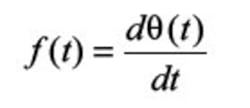
To express this jitter in terms of FM, we will use a few equations. Frequency is the variation of phase with time:
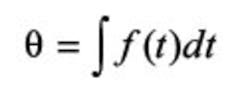
and phase is the integral of frequency:
We define frequency modulation as the variation in frequency from a constant frequency:
or
If we integrate to get phase change, we have:
We define jitter to be:
where:
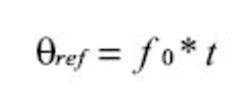
when working with jitter relative to a constant frequency clock. Jitter described as FM is:
The constant frequency terms cancel so jitter is just the integral of FM:
As a result, the jitter or phase change is the integral of the frequency modulation. For SSC, we use a triangle wave shape. When expressed as phase change or jitter, a triangle wave shape is a series of linear functions:
If we integrate this, we get a quadratic:
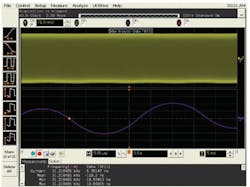
This is the wave shape, a quadratic, rather than a triangle that we will see when looking at SSC as jitter (Figure 3).
We now have related FM to jitter and determined that our triangular-shaped FM waveform will look like a quadratic when viewed as jitter. The TIE is a measurement of phase, so we are measuring the integral of our SSC. As a result, we should see the integral of the triangle waveform, not the original wave shape.
The sine wave actually is our quadratic. It just looks sinusoidal at first glance. The jitter amplitude for a 0.5% downspread, 33-kHz spread-spectrum signal is 18.9 ns. If we want to see the original triangular SSC waveform, we can differentiate our TIE trend using a math function in the oscilloscope. Again, smoothing will help isolate the low-frequency SSC.
Sampling Oscilloscope Jitter Measurement
The situation is different with a sampling oscilloscope. Sampling oscilloscopes require an external trigger signal, usually a clock, to make measurements. The jitter measured is the difference between the jitter on the clock and the jitter on the data.
The clock acts as the ideal reference clock. It can come from the DUT, some other piece of test equipment, or a hardware clock data recovery (CDR) circuit. To measure our SSC, we need a clean clock, one that does not have the spread-spectrum modulation.
This can be harder to accomplish than it would seem. If you are using a signal generator with FM to create your SSC signal, you only have a spread clock. Signal generators usually don�t have an unmodulated output as well as the main output. This is not what we want.
If we use two signal generators set to the same frequency, one with FM and one without, we need the clocks to be locked together to a very tight degree. Tying two signal generators together with their 10-MHz references can be problematic for longer measurements because drift can be large enough to be significant in the measurement.
It is possible to use a CDR circuit to track the SSC and produce a clean clock. But not all CDRs can handle SSC, and the units that can are fairly new and may not be available.
Although we have our clean clock from some source, we still cannot measure our SSC. Sampling oscilloscopes cannot measure jitter greater than a few UIs at best. The SSC for PCI Express is almost 50 UI. You will see a smear of data, very much like a free run trigger.
It is possible to get the triangular waveform you might expect, at the frequency you expect, but this is not real. It is an artifact of the architecture of a sampling oscilloscope.
Due to the design of sampling oscilloscopes, there is delay between the trigger point and the sampling point. The jitter measured is the difference between the jitter on the clock and the jitter on the data, offset in time by the trigger delay:
If the trigger delay is zero, then there would be no measured jitter. The SSC on the clock would match the SSC on the data exactly. If we have a non-zero trigger delay, there is an offset in time in our SSC signals.
If the trigger delay is 40 ns and the SSC is 0.5% downspread at 33 kHz and a triangle waveform, the measured jitter will have a triangle waveform and 200 ps of jitter. This is far less than the 19 ns we measured on our real-time oscilloscope. Differing values of trigger delay will produce differing levels of jitter, none the correct value.
One work-around for this trigger delay is to add a delay line to the data path. If we have a trigger delay of 20 ns, we need a delay line of 20 ns. This would eliminate the jitter displayed as a result of trigger delay.
The problem with this technique is the high-frequency loss a delay line introduces. This is a form of intersymbol interference (ISI) and will affect the transition times and eye opening of our data signal. Depending on the edge rate and data rate, the affect of the delay line may be too great and not allow an accurate measurement.
Conclusions
We can measure SSC, but it can be more complicated than expected. Measuring UI jitter, combined with smoothing, will give us the measurement we want. A period jitter measurement, although a likely first choice, will not work on a data signal.
If we don�t have a UI measurement, we can use the TIE. The key is the difference between FM, or SSC, and phase modulation (PM), or jitter. Because these two quantities are related by integrals and derivatives, it is hard to intuit the TIE measurement result. We have determined that:
- A UI measurement, combined with smoothing, can be used to characterize SSC.
- A period measurement does not work with a data signal.
- A TIE measurement can be used to characterize SSC, but we need to be aware of the nature of FM (SSC) and jitter measurements.
- Triangular FM (SSC) does not produce a triangular jitter trend (PM).
- Triangular FM (SSC) looks like a sinusoidal jitter trend but really is quadratic.
- Getting a clean clock for a sampling oscilloscope can be difficult and potentially a waste of effort.
- A triangular jitter trend on your sampling oscilloscope may not be the correct result for SSC.
- Trigger delay in a sampling oscilloscope can greatly affect a jitter measurement.
About the Authors
Russ McHugh has worked for Agilent Technologies/Hewlett-Packard for 20 years as an application engineer and a systems engineer in the areas of high-speed digital and analog test, measurement automation, custom systems, and data acquisition. He received bachelor and master�s degrees in mechanical engineering from Stanford University. e-mail: [email protected]
Mark Johnson has been an application physicist with Agilent Technologies for six years working in high-speed digital communications and fiber optics. His background is in low-temperature physics and superconducting magnet design. Mr. Johnson holds a master�s of physics degree from Lancaster University in England. e-mail: mark_ [email protected]
Agilent Technologies, 5301 Stevens Creek Blvd., Santa Clara, CA 95051-7201, 877-424-4536
January 2007
