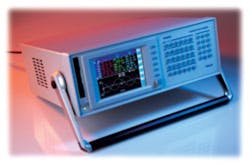
Power monitoring is undertaken for a variety of reasons: to determine the cause of a power-related problem, to confirm that the supply can support added loads, to gather data that might aid in reducing power use, and to verify power quality. Depending on the goal, different types of power monitoring equipment are appropriate.
Several factors distinguish the various classes of power monitors. The minimum amount of information is provided by a monitor that simply records deviations outside of a preset limit. You may know when an event occurred, but without comprehensive measurements of voltage and current on all phases and neutral, it may be very difficult to understand what happened in detail.
At the other extreme is the full-disclosure monitor that continuously records and analyzes current and voltage data sampled at high speed. This type of monitor does not need to be triggered by abnormal voltage or current excursions but rather adaptively adjusts to changing line conditions. Because all the necessary information is available, you can simultaneously address power usage, quality, and troubleshooting objectives.
In addition to technical capabilities, the suitability of a monitor for a given situation also may involve security, ease of connection, and the need for local display and control. If power quality is a high priority, for example in a computer installation, a fixed network of power monitors may be appropriate. If monitoring is a scheduled activity within a company, installing fixed monitoring connectors at strategic points can eliminate errors and increase the safety of personnel.
Where a graphical display and controls are not needed locally, a black-box monitor offers the greatest degree of security. It can�t easily be tampered with and, because it doesn�t resemble a game or portable computer, is unlikely to be stolen.
Power Quality
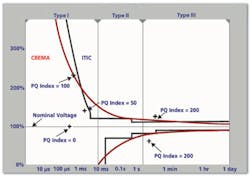
A wide range of characteristics is covered by the term power quality. Figure 1 shows the Computer and Business Equipment Manufacturers Association (CBEMA) and Information Technology Industry Council (ITIC) voltage deviation curves. Only voltage is considered, and deviations are classified by their duration. Because computers and business equipment generally filter the incoming AC supply, the curves allow very large deviations at high frequencies.
Using monitored data, you can plot your facility�s power quality (PQ) index relative to either of these curves. An important consideration is that an individual event often corresponds to several points on the graph. For example, a disturbance may include an initial transient followed by a period of higher or lower voltage and end with a further transient.
Voltage excursions are classified by their duration and distance from the nominal line voltage. Nominal-voltage measurements map to a zero PQ index level. Events that deviate by half the allowed amount are rated at a 50% PQ index.
Figure 1 shows several such points. A plot of PQ index vs. time is a good indication of the overall condition of power being used within your facility. Over time, significant changes are easily identified, prompting more detailed monitoring if necessary.
A power user may create its own curve based on the published voltage tolerances of its sensitive equipment. The CBEMA and ITIC curves are good starting points but perhaps not completely representative of your facility.
Power Quality Monitoring Equipment
Low-cost monitors may only sample the voltage and current signals at a slow rate. You can determine that an event has occurred, but unless it persists for a cycle or more, the monitor will provide little shape or timing detail. In contrast, Fluke�s Model 1750 Three-Phase Power Recorder samples at a 256-S/cycle rate, equivalent to a 65-�s time resolution or a 1.4-degree phase-angle resolution for a 60-Hz supply.
High-speed transients are handled by a separate 14-b, 5-MS/s digitizer. With 200-ns time resolution, you can investigate the high-frequency ringing that may accompany a switching transient or examine the noise from a pulse-width modulated signal.
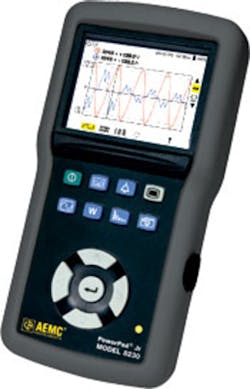
AEMC PowerPad� Model 3945-B with a color graphical display is intended for interactive troubleshooting as well as trend recording. It samples up to four voltage and three current inputs at a 256-S/cycle rate. The 4-MB memory stores four types of data: screen snapshots, transients with pre- and post-event data, alarm events, and trend data.
Monitoring with even moderate resolution causes a conflict between the type of data stored and the amount of memory available. Typically, you must set a threshold to define an abnormal event that will be captured should it occur. Many times you don�t know exactly what you�re looking for, so finding a threshold value that captures most abnormalities without also recording a great deal of normal data is an iterative process.
The immediate and graphical feedback from the AEMC monitor can save a great deal of time in this respect. And, because the monitor is lightweight and battery-powered, suspected problems can be investigated anywhere. Long-term monitoring is possible as well as configuration and control via a PC. AEMC�s DataView software displays real-time waveforms and harmonics through the 50th and includes a report generator. A smaller, single-phase PowerPad� Jr. Model 8230 also is available.
Rather than require you to set capture thresholds, the Fluke 1750 Power Recorder adaptively adjusts to changing power conditions. If events are being recorded at a rate sufficiently high that the memory will fill before the desired monitoring period has elapsed, the threshold is raised and vice versa. In this way, the monitor ensures that as much detail is captured as possible within the time and memory constraints.
The AEMC and Fluke monitors represent two different types of tools. The 1750 is primarily intended for long-term monitoring. A built-in wireless communications link facilitates remote control via a hand-held PDA. For example, test connections can be swapped by reconfiguring the 1750 internally. The PDA also displays measurements and wiring diagrams in full color. For faster communications with a PC, the 1750 has a 10/100Base-T Ethernet interface.
Fluke makes a range of power monitoring products, and the company�s Model 430 Series of hand-held monitors with color graphical display addresses the same types of applications as the AEMC PowerPad products. The PowerPad and Model 430 are powered from either batteries or AC and operate for several hours without an AC supply. The Fluke 1750 runs on AC power and provides a 5-minute UPS facility for each interruption, not exceeding 60 minutes total between battery backup recharges.
The Megger PA9PLUS addresses power quality recording with a unique set of features. Because it�s intended for use in an industrial environment, the meter is built into a heavy-duty protective case. Although not watertight, the nonconductive NEMA 4X (IP54) case resists rain and corrosion.
Electrically, four differential AC/DC voltage inputs and five current channels handle both Y and Delta three-phase connections including neutral and ground currents. One of the four voltage inputs is limited to 350 V and has slightly better accuracy than the other three 600-V channels. The meter is powered from phase A or alternatively from a separate nonrecording IEC-style AC input. In addition, a 12-V backup battery provides up to 15 minutes of recording time if AC power is interrupted.
The PA9PLUS covers a frequency range of 20 to 70 Hz and phase-locks the sampling system to the input for a constant 256 S/cycle resolution. Functions include harmonics to the 63rd, PST and PLT IEC flicker measurement, and the capacity for 64 saved internal setups.
Up to 12 MB of data is stored in the internal flash memory, and this can be augmented by a memory card option accommodating cards with greater than 1-GB capacity. The MEGPA9IEC software application ships with each PA9PLUS instrument and provides charts of waveforms analyzed, bar charts of calculated harmonics, and voltage/current trends as well as a list of all individual harmonic voltages and currents. The software includes a report generator.
According to Michael Daish, vice president marketing and sales at Summit Technology, there are approximately 30 vendors of power monitors. With so many companies involved, it�s helpful that many aspects of power measurements have been standardized by IEC 61000-4-30 Class A. Included within the standard measurements are power frequency, voltage magnitude, harmonics, dips/sags and swells, interruptions, and rapid voltage changes. The standard does not cover high-frequency transients or current-related phenomena.
Among the items to which the standard applies, harmonics calculation is particularly important. Monitors perform an FFT on captured time-domain data to determine harmonic content. With the Class A standard, frequency bins are 5-Hz wide, and all instruments must compute the FFT in the same way, leading to consistent and comparable results.
Nevertheless, innovation is alive and well in power monitoring. Summit Technology�s Mr. Daish described a means of using two instruments to measure network impedance. �If the problem lies somewhere between the source and the load, measuring with one monitor at the load may not reveal the cause of the problem. Impedance measurement relies on using two synchronized meters to measure the conductor or device of interest, usually one meter at the source and one at the load.�
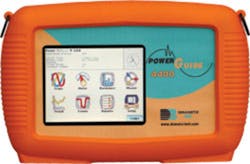
A somewhat larger form factor than a typical hand-held meter is favored by Dranetz-BMI, now part of Global Power Technology. This tablet-style monitor allows a bigger display to be used. In fact, the Dranetz-BMI PowerGuide 4400 Power Quality Analyzer uses a large LCD color touchscreen for all control and display.
Ease of use is important, and you only have to touch the appropriate colorful icon to select any of eight top-level screens: scope, meter, harmonics, phasor, trend, events, reports, and setup. However, technical performance has not been sacrificed. The instrument provides four differential AC/DC voltage inputs, four inputs for current transformers, 256-S/cycle resolution, and cycle-by-cycle analysis. In addition, this monitor measures current inrush when power is first applied to a device.
|
FOR MORE INFORMATION |
| AEMC | Model 8230 | www.rsleads.com/703ee-200 |
| Dranetz-BMI | Model 4400 | www.rsleads.com/703ee-201 |
| Fluke | Model 1750 Power Recorder | www.rsleads.com/703ee-202 |
| Hioki | Model 3196 | www.rsleads.com/703ee-203 |
| Newtons4th | Model PPA2500 KinetiQ | www.rsleads.com/703ee-204 |
| Summit Technology | Power Monitoring Meters | www.rsleads.com/703ee-205 |
| Voltech Instruments | Model PM6000 | www.rsleads.com/703ee-206 |
| Xitron Technologies | Model 2802 | www.rsleads.com/703ee-207 |
| Megger | Model PA9PLUS Power Analyzer | www.rsleads.com/703ee-208 |
Hioki also uses a large LCD panel in the Model 3196 Power Quality Analyzer although this is not a touchscreen and operation is via separate push-button controls. A range of versions addresses single-phase 2-wire through three-phase 4-wire applications. A generous 13-MB internal memory supports long-term monitoring and, with a flash ATA card, capacity can be extended to 528 MB.
A 256-S/cycle sampling rate is used for measurements, 170-S/cycle for harmonic calculation, and 2-MS/s for fast transient capture. Measurement accuracy is 0.2% of reading +0.1% of full scale for AC measurements and 0.3% + 0.4% for DC. Harmonics are calculated through the 50th order using a rectangular window.
Beyond Portable Monitors
For which applications is a portable power quality monitor not suitable? These instruments continue to increase functionality and accuracy by taking advantage of improved technology, but benchtop power analyzers manage to stay a few steps ahead. Two major distinguishing characteristics are accuracy and sampling rate, both up to 10� higher than in a portable unit.
Harmonic analysis of switch-mode power supplies (SMPS) involves much higher frequencies than analysis of 60-Hz harmonics. For example, the Voltech Instruments� Model PM6000 Power Analyzer samples at a 5- to 40-MS/s rate on three voltage and three current channels to support a power bandwidth of 10 MHz.
Variable-frequency motor drives have long been an application that required a high-end power analyzer. A separate DC input and a means of monitoring motor speed are combined with three-phase current and voltage measurements to completely characterize the drive�s performance. Again, high bandwidth is necessary to handle the high-frequency harmonics generated by typical pulse-width modulated (PWM) drives.
Modern fluorescent lighting ballasts are another form of high-frequency SMPS with multiple high-voltage outputs. Many of these products have special start-up modes depending on the type of lamp being driven. An additional advantage of an electronic ballast is its near-unity power factor. Of course, efficiency also is critical. For these kinds of high-frequency applications, portable power quality analyzers lack the required bandwidth and sampling rate.
A further trend related to efficiency is reducing standby power. According to Owen Wiseman, U.S. sales manager for Voltech, �We need to be able to accurately measure the low power of a product in standby mode. The PM6000 has a basic 0.02% accuracy, a high sampling rate, and a built-in watt-hour integrator to determine standby-mode performance.�
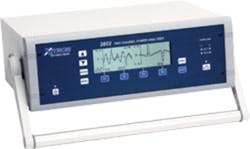
Xitron Technologies� Vice President of Marketing and Product Development Dennis Schlaht continued this theme. �We are seeing two major trends today toward drastically lower power levels and higher efficiencies. These are driving higher accuracy in lower measurement ranges while maintaining high upper ranges for full-featured, high-performance running levels.
�Many power analyzers do not measure accurately at current levels from 1 mA to 10 mA and especially when low power factors are combined with low levels,� he continued. �The new 280X Series Power Analyzers have been developed especially to address standby power and energy compliance issues. An integrated line switch allows you to select the phase of the voltage waveform at which the switch turns on in one-degree increments. This facility together with inrush current measurement provides complete device turn-on characterization.�
Measurement accuracy is specified to be greater than 0.2% of reading for voltages above 1.0 V and currents above 1 mA. In contrast, Xitron�s earlier Model 2503AH High-Performance Power Analyzer with the high-accuracy option achieves 0.2% accuracy only for voltages greater than 7 V and currents greater than 10 mA.
Accuracy depends on many factors, as explained in a qualifying statement in the user�s manual for the 2503AH Analyzer: �High accuracy option specifications are for input frequencies between 40 and 450 Hz, autoranging enabled, for crest factors less than 1.8, power factors greater than 0.9, 20-kHz filter frequency.�
The 280X Analyzers measure up to 2,000-V peak and, via internal shunts, up to 150-A peak current. Most power quality analyzers and monitors support higher current measurement through the use of external current transformers (CTs); however, accuracy may degrade when these are used. It�s important to choose an instrument that can directly handle the maximum current to be measured if high accuracy is important.
Another new power analyzer, the Model PPA2500 KinetiQ from Newtons4th Ltd., also addresses higher frequency applications but features power monitoring capabilities as well. Sampling at 2.2 MS/s on all channels, recording up to 8,000 acquisitions, and real-time datalogging suit power monitoring well. However, a 0.04% basic accuracy, torque and speed ports, and harmonics computation to the 76th are high-performance power analyzer functions.
Summary
Electrical power quality is critical to most industries as well as consumers. Monitoring power usage and quality provides the information needed to reduce costs and solve equipment operating problems. Depending on the type of power disturbance and the reasons you have chosen to monitor, one instrument may be more appropriate than another.
Monitoring implies an extended period of time although it may be possible to understand a problem very quickly using the color graphical displays in many modern instruments. Voltage and current waveforms are presented in an oscilloscope-type format, three-phase signals are displayed on a phasor diagram, data preceding a transient event can be examined, and a full complement of trend data is available.
Should you need to monitor power quality for a long time, some instruments have built-in hard disk drives, and others support flash memory cards. In either case, hundreds of megabytes or even gigabytes of storage are available.
Improving efficiency and reducing standby power have become important goals for power supply and equipment designers. According to a recent Xitron technical bulletin, billions of external AC/DC power supplies are being used in the United States alone. Although each may account for only a few tens of watts, together they represent as much as 6% of the total power used.
Because many of these supplies are designed to be as cheap as possible, low efficiency often follows. Small SMPS can be 90% efficient, but many very low-cost supplies are less than 50% efficient, wasting more power than they deliver. For example, in the United States, an average household wastes an estimated 50 watts continuously because of the standby power drawn by inefficient external power supplies.
For the development of more efficient SMPS designs, a high-frequency power analyzer is required. Newer power analyzers also achieve far better accuracy at low standby power levels than do typical monitors. The analyzer may have a 1-V full-scale range, for example, where monitors are designed to accurately measure 120- or 240-V rms and deviations from these nominal values.
Power analyzers also are the instruments of choice for PWM motor drive development. The multiple phases required in these applications are synthesized using PWM techniques, and interference can result from the high-speed edges of the individual pulses. Motor drive development requires dealing with fast transients as well as the capability to work with the lower frequency synthesized single- or three-phase voltages and currents.
New components and standards have improved power-quality monitor and power analyzer capabilities. Choosing either type of instrument starts with a clear understanding of your objectives. The good news is that there are many models of monitors and analyzers to choose among with the usual feature/benefit/cost trade-offs.
March 2007

