Error vector magnitude (EVM) is slowly becoming a mainstream production test. The reason? New and emerging standards utilizing complex digital modulation will require a system-level test to ensure all radios are on and functioning properly. Older ATE architectures using conventional methods required 5x to 10x more EVM test time than traditional parametric tests, which was the key factor postponing it from becoming a mainstream production test.
But the time required for EVM testing can be reduced substantially by the development of algorithms that take advantage of the new ATE architectures. Since the signal from the arbitrary waveform generator never changes in a test scenario, the demodulation process is not necessary as part of the EVM calculation. This eliminates a large percentage of the traditional EVM test time.
The reference or demodulated signal can be predetermined and stored as part of the test program. One method using EVM not only makes it possible to increase test coverage via system-level testing, but it also identifies the parametric failure with little or no additional test time.
MIMO/OFDM Production Testing Challenges
The foundation of virtually all next-generation communications systems will be a multiple-input multiple-output/orthogonal frequency division multiplexing (MIMI/OFDM) physical layer because it provides improved network capacity, robustness, mobility, and spectral efficiency. For example, the WiMAX, WiBro, 802.11n, UWB, and 3G LTE broadband communications systems all use multiple antennas at both the base station and user terminal with a scalable OFDM physical layer (PHY) that supports variable bandwidth communications configurations.
The primary method for implementing MIMO/OFDM technologies is a two-chip solution consisting of RF and baseband processors. The traditional interface between these two chips consists of an analog in-phase (I) and quadrature (Q) link. Traditionally, filter responses, magnitude and phase imbalances, and other parametric measurements have been used to quantify the measurement of this link.
This signal interface has largely moved to a digital link as MIMO/OFDM systems migrate to a zero intermediate frequency (ZIF) architecture. The baseband I and Q components are directly converted into RF and feed the power antenna for transmission. When the receiver is operating, the RF signal goes through the I/Q demodulator and converts directly to I and Q baseband components.
A wide range of impairments can affect the performance of the MIMO/OFDM system including noise and amplitude and phase imbalances between the I and Q signal paths. Other impairments such as, phase noise, local oscillator leakage, and carrier frequency accuracy also can influence the performance of the MIMO/OFDM system.
The traditional approach used for testing MIMO/OFDM ICs is to perform parametric measurements such as noise figure, SNR, IQ phase imbalance, IQ amplitude imbalance, and phase noise. These tests typically might take greater than 200 ms to perform.
Also, parametric tests inherently check only individual radios. As digital modulation becomes more complex, these tests become less and less effective.
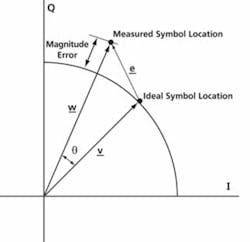
EVM is the gold standard used during research and development to characterize MIMO/OFDM modulators in the presence of impairments. EVM measures the performance of the entire MIMO/OFDM system. The measured symbol locations obtained after recovering the waveform at the demodulator output are compared against the ideal symbol locations. The root mean square (rms) EVM and phase error are then used to determine the EVM measurement of the window of demodulated symbols as shown in Figure 1.
Figure 1. Calculation of EVM Measurement
Addressing EVM Test Time Requirements
In real operating scenarios where two wireless devices are attempting to communicate, it’s imperative that they be both phase and frequency locked. Since either or both devices may be mobile, the channel conditions will change with mobility so the devices must work in a variety of environments and under a wide range of conditions.
This typically is accomplished by using a training sequence that determines the channel or air between the two devices. The transmitter sends a known sequence to the receiver. The receiver knows what the transmitter is sending. The receiver demodulates then compares the received sequence against its expectation to estimate both the frequency and phase and make corrections to itself. As soon as that process is completed, the transmitter and receiver can begin data transmissions.
Traditional EVM measurements performed during the development phase use a similar training process for each test to check the capability of the IC to correct itself. In the relatively rare occasions when EVM is carried over as a production test, a similar process almost always has been used. This is partly because there is a natural tendency to carry over the same test methods from the development environment. Also, the propagation delay might vary from DUT to DUT, which could affect test results.
Consequently, EVM production testing typically has taken 300 ms or greater, which is considerably more than the parametric tests it is potentially capable of replacing. While EVM provides a superior measure of overall system performance, traditional EVM measurements do not specifically identify the source of the problem and are less useful in troubleshooting.
Production testing, however, differs substantially from both real-world usage and development testing. The test equipment acts as both the transmitter and receiver.
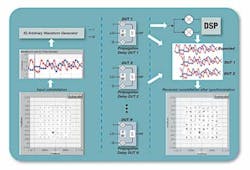
Figure 2 shows a production test that determines the EVM of the baseband-to-RF transmitter chain. A baseband IQ signal is applied to the input of the DUT using the test system’s arbitrary waveform generator. The RF output of the DUT is captured and processed by the test system’s vector signal analyzer to determine the EVM.
Figure 2. EVM Production Testing on an ATE System
The channel consists of the tester, load board, fixtures, and cables. The input signal never changes. We can take advantage of that and dramatically reduce the EVM test time.
The signal can be predetermined and stored as part of the test program, resulting in a test time typically less than 50 ms. The propagation delay can be measured in the beginning and then stored as a variable in the test program. If the tester is very stable, then the only variation is the DUT.
If the propagation delay between the DUTs is too large, it may be necessary to synchronize the input data to the captured output. This can be readily addressed by the ATE EVM algorithm. Once the synchronization is performed, the EVM can be calculated directly by comparing the input and captured output IQ waveforms.
Identifying the Failure Mechanism
An even more challenging issue is identifying the failure mechanism. EVM rms is a system-level test that inherently provides little information on the cause of a failure. However, recent advancements in ATE systems make it possible to identify the failure mechanism without adversely impacting test time.
Previous ATE architectures took an approach in which the modules used to control testing of individual DUTs offloaded intensive DSP to an off-the-shelf or custom computer. However, as the degree of parallelism of ATE has increased, even the most powerful computers have had difficulty in keeping up with the larger number of offloaded computing tasks.
In the past few years, this approach has been superseded by one originally pioneered in memory chip testers in which multicore computers are used to power ATE modules that run test algorithms for individual DUTs. The latest generation of modules operates at speeds as high as 800 Mb/s and offers up to 128 channels.
Test modules are easily interchangeable to suit the type of DUT. Improvements in EDA to ATE tools simplify programming by integrating the device simulator with the test simulator for seamless test debug without silicon, enabling the development of more complex programs in less time.
Two potential approaches take advantage of these capabilities to identify the failure mechanism of chips that do not pass EVM testing. The first one involves running the parametric tests on a separate process only for chips that fail EVM. This approach has a minimal impact on production test time since the secondary thread only runs occasionally. When it does, the primary thread continues without interruption, performing the EVM test on the next chip while the chip that failed is undergoing parametric testing.
The additional threads needed to determine the failure mechanism normally have only a minor effect on cycle time. The failure mechanism is determined by the same approach that currently is used so the results will be familiar to those who are responsible for analyzing them.
A more innovative approach offers the potential for even lower production test times. It analyzes the large amount of information provided by EVM testing to determine the failure mechanism without parametric testing.
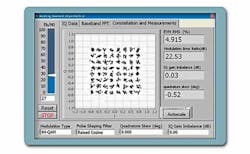
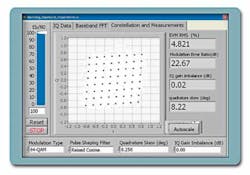
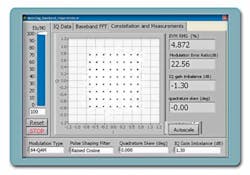
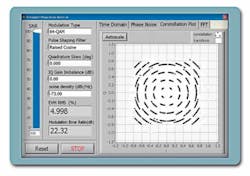
Figures 3a, 3b, 4a, and 4b use a 64 QAM example to show how this might work. For 64 QAM to function properly, the EVM must be less than 5.62%. In this case, let’s assume the device’s specification is 3%.
Figure 3a. EVM Test Results With Noise
Figure 3b. EVM Test Results With 8.25 Degrees Phase Imbalance
Figure 4a. EVM Test Results With 1.3-dB Amplitude Imbalance
Figure 4b. EVM Test Results With -100-dBc/Hz Phase Noise at 1-kHz Offset
EVM measurements are shown on four different ICs with different failure mechanisms: Figure 3a = 4.915%, Figure 3b = 4.821%, Figure 4a = 4.872% and Figure 4b = 4.998%. These DUTs are all fails.
The failure mechanism of each chip can easily be determined by examining the EVM constellation: Figure 3a—noise, Figure 3b—IQ phase imbalance, Figure 4a—amplitude imbalance, and Figure 4b—phase noise.
If you can easily determine the failure mechanism by examining the constellation, you also could append the EVM algorithm to determine the same results mathematically. The modified EVM algorithm can run post-test or on a secondary thread if multiple cores are available. This approach should need less time than rerunning the parametric tests since it only requires that additional analysis be performed on test data that already has been captured from the DUT.
Conclusion
EVM production test is becoming a requirement for leading-edge MIMO/OFDM devices because of its capability to test the system-level performance. Some device manufacturers have attempted to postpone the implementation of EVM testing because it will slow production test time and make it more difficult to identify the specific failure mechanism.
By developing test algorithms that take advantage of the specific characteristics of EVM and the nature of production test, these concerns disappear. Table 1 demonstrates that not only can EVM testing be performed in substantially less time than traditional parametric testing, but it also can be accomplished even while identifying the failure mechanism for chips that fail EVM testing.
Table 1. EVM Production Test Time Savings Summary
About the Author
Keith Schaub is an RF product engineer with Advantest America and the author of Production Testing of RF and System-on-a-Chip Devices for Wireless Communications. He has an M.S. in electrical engineering from the University of Texas, Dallas. Advantest America, 1515 S. Capital of Texas Hwy., Suite 220, Austin, TX 78746, 512-289-7647, e-mail: [email protected]
January 2008

