Chirp measurements in radar applications are used to determine the quality of transmitted pulses. The primary quality indicators revolve around the need for the transmitted pulse to be free of distortions or artifacts.
The impulse response measurement, also known as time sidelobe measurement, can be used to verify the performance of frequency chirped pulses. For testing pulsed hopping chirp radar signals, the center frequency offset measurement is a viable technique.
Modern radar designs have created complicated pulses presenting significant measurement challenges. Improvements to range, resolution, and immunity to interference have required phase-modulated pulses, frequency chirped pulses, and very narrow pulses, with many of these exhibiting wide bandwidth.
During verification of the design of radar, there is a need to confirm that the transmitted signal is correct, the receiver responds to correct signals, and no unexpected signals are emitted from the transmitter.
Unexpected outputs can range from unintended signals related to the desired pulse, such as harmonics, subharmonics, or image mixing products as well as spurious outputs unrelated to the desired pulse, including radiation of internal local oscillators, coupling from digital clocks, spurious oscillations within RF circuitry, and pulse errors.
In software-defined radar, modulated pulses, chirps, and other waveforms often are created not with traditional analog circuitry but with DSP and DDS techniques that digitally synthesize complicated signals directly at IF or RF frequencies. These only become analog when the synthesized digital data is put through a D/A converter. Within the DSP, subtle computer code errors such as illegal filter values or numeric expressions can create very short-duration signals that may bear little or no relation to the desired output.
Chirp Measurements
Specialized measurements are required for verification of the performance of frequency chirped pulses. For simple time-of-flight pulsed CW radar, the main concern is that the timing parameters of the pulse be as intended. For chirp radar, possible transmitted errors causing problems in the receiver often are more subtle. While parameters such as pulse timing, center frequency, chirp frequency width, and frequency errors across the chirp can cause problems, when the transmitter adds these to the radiated signal, phase errors across each pulse as well as from one pulse to another are less obvious but also can impact quality.
Chirp measurements depend on determinations of pulse position, timing, cardinal points, and carrier frequency offset. The frequency offset and the pulse start and stop times are very critical to chirp measurements. All of the frequency and phase measurements are referenced to the carrier frequency. The start and stop times of the pulse also determine where chirp total deviation measurements are made.
Dynamic Range Requirements for Chirp Measurements
Automated pulse measurements originally were developed for use on spectrum analyzers, some of which have up to a 78-dB typical spurious free dynamic range (SFDR) at a 110-MHz wide acquisition bandwidth. Neglecting both A/D distortion/noise/bandwidth additions as well as possible reductions of noise and distortion due to the application of DSP, the SNR can approximate 6 dB per bit.
An oscilloscope typically has a resolution of 8 bits, with an ENOB of somewhat less than 8 bits. While this sometimes has been thought to be insufficient for chirp radar measurements, there are many cases where the oscilloscope’s dynamic range can be used effectively.
Oversampling also increases the dynamic range by a log ratio of the sample rate divided by the Nyquist sample rate provided the internal noise and spurs of the oscilloscope do not contribute to the measurement uncertainty. When you consider the 50-GHz sampling rates of higher-end oscilloscopes and the Nyquist sampling required for analyzing chirps of 1 GHz (~2.5-GHz sample rate), the resultant increase in total effective bits dynamic range can be greater than 13 dB.
Impulse Response Measurements
Impulse response (IPR) usually is thought of as a time-domain measurement of the input-to-output transfer response of a network. This measurement usually is performed by a network analyzer on separate components such as amplifiers, filters, or switches.
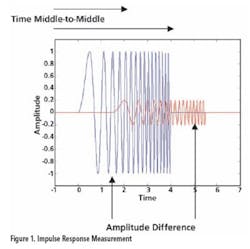
IPR also can be considered a swept correlation looking for copies of the reference signal. Any reflections or otherwise delayed copies of the main chirp will show up in the output plot as a sidelobe of the main lobe. The amplitude and time delay of each secondary pulse copy will be represented as the sidelobe amplitude and location. The amplitude is normalized to the amplitude of the main chirp. For this reason, the IPR measurement is sometimes referred to as a time sidelobe measurement.
Of the other available chirp measurements, none of them can replace the detail or the insight of the IPR measurement method:
• Frequency vs. Time can work only for single RF signals at any time. If multiple signals are present, an FM discriminator will only follow the higher amplitude signal or produce noise.
• Spectrogram can see multiple signals at the same time; however, it cannot compare two signals for errors if they are copies of one another. More importantly, the spectrogram is limited in time resolution. It can see no shorter time than one FFT frame of the digitized samples of the signal.
The IPR method shows both time and amplitude simultaneously for signals that are copies of one another.
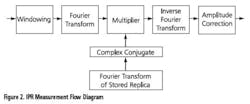
The calculations follow the block diagram shown in Figure 2. After the RF pulse is digitized, a time window is applied to reduce the unwanted sidelobes that result from an FFT mathematics when the input signal is finite time limited. For the IPR, the Taylor window is a good compromise between the lobe width and the residual sidelobe level.
After the windowing, an FFT or other discrete time transform is performed to give a frequency-domain intermediate result. This spectrum is multiplied by the complex conjugate of an ideal chirp. This de-chirps the pulse.
The ideal chirp can be estimated by the measurement routine as a best-fit against the incoming signal. Or you can enter the ideal chirp slope for a more accurate measurement.
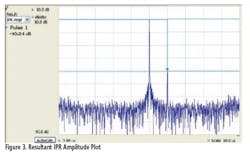
After the multiplication, an Inverse FFT is performed to transform back to the time domain. The result is a standard IPR plot. The last block applies an amplitude correction to the IPR plot which is shown in Figure 3.
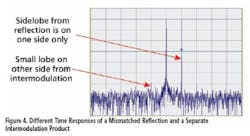
As the chirp changes frequency, the sidebands move along with the carrier and are indistinguishable from any other sidelobe except that they appear on both sides of the main lobe. These may be difficult to see using FFT spectrum analyzer methods since the minimum time resolution of an FFT is the time occupied by the entire frame of digitized samples used by the FFT.
The relationship between the impulse sidelobe delay time and the frequency components of the chirp is given by
?T = Fm (Td / Fd)
where:
?T = time difference between the time sidelobes and the main lobe
Fm = frequency of the incidental modulation
Td = duration time of the chirp
Fd = frequency sweep width during the chirp
Figure 4 shows the different time responses of the mismatched reflection and a separate intermodulation product. The IRP measurement method can be an important tool in assessing the overall quality of the chirp response.
Center Frequency Offset Measurements
Measurements on hopping radar signals, signals over the air, and even signals in the presence of adjacent channel interference typically have represented a challenge for measurement systems. Traditionally, either modulation hopping was required to be turned off or you were challenged to capture a pulse sequence at the center frequency to analyze the radar signal.
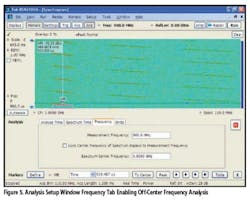
The flexibility to measure signals that are not captured in the center of the analysis bandwidth can be extremely important in the analysis of the true hopping behavior of radar. Figure 5 shows a frequency hopped pulse signal. By deselecting the measurement frequency lock to the center frequency, a sliding measurement window appears, allowing selection of the frequency of interest over the acquired spectrum.
This signal is a pulsed hopping chirp radar signal that hops across three frequency channels sequentially. The window has been selected to measure just the pulses in the acquired spectrum lowest in frequency.
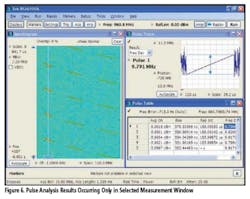
Figure 6 demonstrates the results of the pulse signals occurring only in the selected measurement window. The subsequent frequency stepped pulses are not included in these measurement results. However, once the data has been captured into memory, the sliding measurement window can be positioned over the subsequently occupied hopping channels, and the data can be replayed to calculate the results of the subsequent hops.
The flexibility of selecting a measurement window that is not at the center frequency is an invaluable method for over-the-air measurements and testing for problems with radars that only manifest themselves during hopping conditions such as frequency settling and timing issues.
Summary
Radar chirp measurement is critical for determining that transmitted pulses are free of distortions or artifacts. IPR measurement, also known as time sidelobe measurement, is an effective method for verification of the performance of frequency chirped pulses and offers more detail and insight than either frequency vs. time or spectrogram methods. We also looked at a way to measure signals that are not captured in the center of the analysis bandwidth, which can be extremely important in the analysis of the true hopping behavior of a radar signal.
About the Author
Darren McCarthy is the RF technical marketing manager for Tektronix. He has worked extensively in various test and measurement positions for more than 25 years including R&D engineer and project manager, product planning, and business and market development. During his career, Mr. McCarthy has represented the United States and Tektronix as a technical advisor and group member on several standard working groups and forums. He holds a B.S.E.E. from Northwestern University. Tektronix, 14150 S.W. Karl Braun Dr., P.O. Box 500, Beaverton, OR 97077, e-mail: [email protected]
