Analog measurement resources in today’s mixed-signal ATE use ADCs, and the test methodologies are based on DSP. Two types of measurement resources are distinguished by the relationship of the test signal frequency to the ADC sampling frequency (Fs). If the test signal is band-limited less than Fs/2, the resource is called a digitizer. Low-pass anti-aliasing filters are implemented in the front end of digitizers to restrict the frequency components to be lower than Fs/2.
If the test signal frequency is higher than Fs/2, the resource is called a sampler. A sample-and-hold device, which performs frequency down conversion, is integrated in the front end. The signal path from the input terminal to the sampling head is carefully designed to keep as wide a frequency bandwidth as possible. The Nyquist sampling theorem differentiates samplers from digitizers. Undersampling is a term that explains the function of samplers relative to the Nyquist frequency Fs/2.
Undersampling
The coherent condition is fundamental for successful measurement in DSP-based testing and described by:
-
where: Ft = the test signal frequency
-
M = the number of test signal cycles in the unit test period
-
N = the number of sampling points in the unit test period
-
For coherency, M and N must be integers and mutually prime. N usually is selected as 2n for convenience of performing FFT so that M is good enough as an odd integer. This relationship ensures that an integer number of cycles exactly fit within the sampling interval—the definition of coherency.
Figure 1. Undersampling
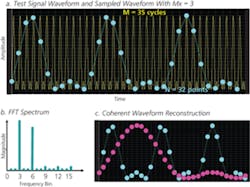
An M = 35-cycle test signal waveform is illustrated in Figure 1a with the yellow trace. When the signal is sampled with N = 32 points, the blue dots indicate the sampled points. Because of aliasing, the trace of sampled data looks like a three-cycle waveform. M/N equals 35/32, so that it is strictly coherent, but this condition does not conform to the Nyquist theorem. However, the FFT spectrum shown in Figure 1b can provide characteristic information about the test signal such as the signal level and the harmonics. This is the essence of undersampling.
Coherent Waveform Reconstruction
If you took pictures of a traditional analog clock 32 times with a constant pace for three hours, the camera would flash every 180/32 = 5.625 minutes. The minute hand of the clock rotates three revolutions for 180 minutes, and all 32 photographs taken for three hours record different locations of the minute hand. This is because 3 and 32 are mutually prime.
This analogy suggests that when a three-cycle sinusoidal waveform is sampled with 32 points, each one of the sampled points has an individual primary phase within 2? radian. No primary phase values are duplicated.
For that reason, if you reshuffle the sampled sinusoidal data according to the primary phase order, it can be reconstructed to a single cycle sinusoidal waveform, an operation called coherent waveform reconstruction. Mixed-signal ATE must provide the dedicated command to perform coherent reconstruction. If you apply this processing to the blue dots in Figure 1, a single-cycle test signal waveform is successfully reconstructed as the red dots shown in Figure 1c.
This reconstruction often is applied in early debugging stages of mixed-signal test development. By performing reconstruction on the raw waveform uploaded from a digitizer and examining the resulting waveform, you can easily verify if the measurement was successfully performed as planned. Of course, coherent waveform reconstruction can be positively utilized for many applications.
Page Concept
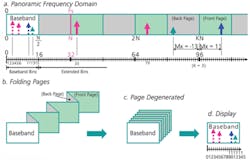
Figure 2a illustrates the ribbon of panoramic frequency spectrum domain. The actual sampling frequency is located at the red line labeled Fs. The horizontal axis is marked in the spectrum bin numbers. For this example with N = 32, the baseband bin numbers are 0, 1, 2 through 15. Extended bin values are 16 and greater.
Figure 2. Page Concept
The broad frequency ribbon can be considered as a series of concatenated N/2-size pages. When undersampling is performed, you can think of the overall spectrum being folded page-wise as Figure 2b illustrates with the colored pages called front pages and the gray pages called back pages. Finally, the entire frequency domain degenerates into the baseband page as Figure 2c, and what you can see in the FFT result is only one baseband page shown as Figure 2d.
For instance, the undersampled waveform shown in Figure 1 has the frequency spectrum at the bins 3 and 6 marked as red arrows in Figure 2d. However, the true test signal spectra actually are located at the extended bins 35 and 70 as Figure 2a illustrates with red arrows. This is the way a waveform sampler can capture and analyze very high-frequency signals in spite of violating the Nyquist condition.
The Extended Coherency Equation
In Equation 1, the Ft usually is much higher than Fs so that M also is greater than N. Then Equation 1 can be modified as
where: K is an integer
Mx should be selected within from -N/2 to N/2
This is the extended coherency equation for undersampling. For the signal in Figure 1, the equation becomes
Ft/Fs = 35/32 = 1 + 3/32.
The blue and green arrows in Figure 2a help to explain what K and Mx mean. If a test signal spectrum is located in the front page of K = 3 (bin 96) and, for instance, Mx = 11, this signal is aliased and found at bin 11 in the baseband. If a test signal is located in the back page of K = 3 and, for instance, Mx = -13, this signal is aliased and found at bin 13 in the baseband. As a result, the FFT spectrum display looks like Figure 2d. Consequently, the absolute value of Mx or |Mx| means the aliased bin location in the baseband. Mx can be named the aliased bin number, and K is the zone number.
Figure 3. Aliased Bin Number Mx
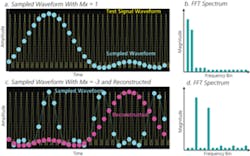
Figure 3 illustrates the same signal shown in Figure 1 (yellow lines), which is undersampled with different sampling conditions (blue dots). In Figure 3a, a 33-cycle waveform is sampled with 32 points. Accordingly, the coherency equation becomes M/N = 33/32 = 1 + 1/32 and Mx = 1. Then the captured waveform clearly looks like a single cycle waveform, and the FFT spectrum is shown in Figure 3b.
In Figure 3c, a 29-cycle waveform is sampled with 32 points. Now, the coherency equation becomes M/N = 29/32 = 1 – 3/32 so that Mx = -3. The captured waveform illustrated by the blue dots shows a three-cycle waveform so that the FFT spectrum looks like Figure 3d. By performing the coherent reconstruction of the blue-dot data, a single-cycle waveform is displayed as the red dots show; however, it actually appears inside out.
If the sign of Mx is negative, meaning the signal is located in a back page, the captured waveform appears inside out. It’s best to set up your test condition so that Mx is positive as often as possible. Otherwise you may want to rearrange the order of the captured data array to recover the normal waveform.
As shown in Figure 3a, a single cycle of the test signal waveform is captured directly in the baseband when Mx = 1, and this is the preferred value if you need to analyze the signal waveform. When Mx >1, Mx cycles of the test signal waveform are captured in the baseband.
After applying the FFT, you can examine the characteristic parameters of the signal such as the fundamental level, the harmonic distortion, and the residual phase noise as shown in Figure 1a and Figure 1b. Accordingly, if you need to analyze the spectrum of the signal, you should select Mx >1. If you need to examine the waveform as well as the spectrum, you can use coherent reconstruction to reorganize a single-cycle waveform with the key number Mx shown in Figure 1c.
When you make a test plan for undersampling, each of the four parameters in Equation 2 should be carefully selected. The Ft probably is given or fixed by the test specification. Second, you should choose N, which is recommended to be restricted to 2n to facilitate the FFT.
The next thing you should keep in mind is the frequency range of the sampler that you are going to use. Temporarily select the maximum sampling frequency [Fs(max)] as Fs. You can calculate M from Equation 2 using the values for Ft, N, and Fs(max). Then you can choose Mx within from -N/2 to N/2.
For waveform analysis, Mx = 1; for frequency spectrum analysis, Mx >1 and odd. You have a lot of freedom in this option. If you want to display a good graphical image of the frequency spectrum, select Mx as an odd number approximately 1/20 of N. Then you would see the fundamental tone at around 1/10 away from the DC bin and the 2nd through the 9th harmonics well aligned regularly in the display. For example, if you have N = 1,024, you could choose Mx = 51. Then harmonics would be found at 102, 153, …, 459.
Now that you have decided on Ft, N, and Mx, you can determine the exact Fs, which can require several digits of resolution. You must program the precise sampling frequency in the sampler hardware. For that reason, a mixed-signal ATE must provide at least two master clocks integrated in the system because the base frequencies in the signal source side (DUT) and the measurement side (sampler) often form an extremely coherent ratio.
Capturing Wideband Signals
By using the page concept and the extended coherency equation, you can easily make up the desired test condition for measuring simple tones such as illustrated in Figure 2a. What would happen if the test signal were a modulated signal or multitone signal? These signals have a distributed spectrum in a certain bandwidth.
Even when you apply undersampling for a wideband spread-spectrum signal, the entire signal spectra must be captured in the baseband so you must be aware of the target test signal bandwidth. If the signal distribution is limited within the page size, which means Fs/2 and N/2, the whole spectrum can completely be aliased and replicated in the baseband. For example, if a DAC were generating a modulated signal repetitively, the signal spectrum would become a set of L line spectra.
In selecting the undersampling conditions, the object is to make all L lines fit in a front page in the sampler domain. N/2 is the page size and the number of baseband bins. To capture L lines of spectra in the baseband, the rule of N >2L is derived. Denoting Fres = Fs/N, the sampler’s frequency resolution, each one of the signal spectra must coincide with the sampler’s extended bin locations so that the rule of ?F = NxFres is derived, where Nx is a natural integer multiple: 1, 2, 3… .
First, decide the number of N. Then the sampler’s actual Fs can be fixed by Fs = N?F/Nx. You can determine an appropriate Fs by incrementing Nx starting from 1. Now that the whole spectrum image is arranged to be in a front page, the set of the signal spectra will be aliased and replicated in the baseband.
Figure 4. Undersampling of Wideband Signal
If the bandwidth of the signal exceeds the page size, then the test condition must be designed so that the aliased bin numbers do not duplicate each other in the baseband. Once conflict occurs, you cannot separate the samples, and it becomes impossible to reconstruct the original waveform and spectrum.
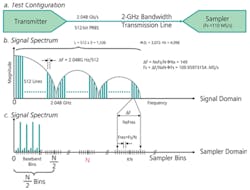
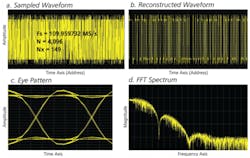
Figure 4 illustrates a typical example. The transmitter generates a 512-bit pseudorandom binary sequence (PRBS) bit stream at the speed of 2.048 Gb/s. The signal goes through the 2-GHz bandwidth transmission line to the waveform sampler whose maximum sampling frequency is 110 MS/s (Figure 4a). Because the data loops every 512 bits, the signal generates 512 lines of spectra per 2.048 GHz as Figure 4b illustrates. If a total of L lines of spectra needs to be captured in the baseband, N must conform to N >2L.
Each one of the multitone spectra must exactly match one of the sampler’s extended bin locations so that ?F = NxFres = NxFs/N (Figure 4c). If Nx is an even number, when the spectrum domain is folded page-wise, many of the signal tones fall in the same locations in the baseband. So Nx must be chosen as an appropriate odd integer. In summary, the planning procedure for capturing a wideband signal by undersampling requires three choices:
- N >2L, (N = 2n)
- ?F = NxFres, (Fres = Fs/N = DF/Nx)
- Nx = Odd Integer, (Fs = N?F/Nx)
For the 512 PRBS example, ?F can be calculated as 2.048 GHz/512. First, as illustrated in Figure 4b, I decided to measure the main lobe and two side lobes of the signal spectrum, meaning there are L = 512 x 3 = 1,536 lines of spectra to be aliased appropriately in the baseband. Next, I chose N as 4,096 which is greater than 2L = 3,072. Considering the maximum sampling frequency of the sampler is 110 MS/s, the 2nd rule DF = NxFres = Nx(Fs/N) resolves the odd number Nx = 149. Finally, the actual Fs is fixed as 109.95973154…MS/s.
Figure 5. Simulation of Wideband Signal Undersampling
After the condition was set up in the resource, the sampler captured the raw waveform shown in Figure 5a. After performing the coherent reconstruction with the key number 149, Figure 5b shows the reorganized PRBS waveform. Now that the original signal waveform is reconstructed, the eye pattern and the frequency spectrum are shown as Figure 5c and Figure 5d. These are simulation results.
Conclusion
Undersampling often is used for measuring very high frequency signals in mixed-signal ATE. The new page concept and the extended coherency equation give clear images of what undersampling is and how a waveform sampler can capture very high frequency signals in spite of exceeding the Nyquist theorem.
Interestingly, since undersampling violates the Nyquist theorem, you may wonder if something is lost in the signal information, and if so, what is it? It is frequency information. When we make up test plans to do undersampling and set up the test condition in the ATE, we already know what the test signal is, how it would be output from the device, and how it would be observed by the sampler. As a result, we can successfully complete tests by undersampling while losing frequency information. ATE uses well-known signals and analyzes changes of signal quality.
About the Author
Hideo Okawara is a principal consultant of mixed-signal test applications in the Digital Consumer Center of Expertise at Verigy. After earning a B.S.E.E. and an M.S.E.E. from Tohoku University, Japan, he joined Hewlett-Packard in 1975. Since 1988, he has been working as an application engineer and consultant for mixed-signal SOC testers. Mr. Okawara is a member of the IEEE Computer Society and ITC Asian Subcommittee and has been active in recent test conferences and symposia. Verigy Japan, 9-1 Takakura-cho, Hachioji, Tokyo 192-0033, Japan, +81-426318337, [email protected]


