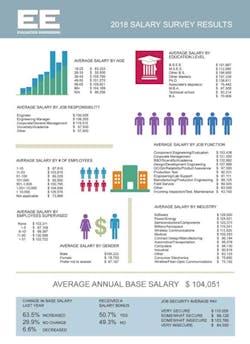
The results of the EE-Evaluation Engineering 2018 salary survey are in, and those results give us a glimpse at modest shifts in the engineering world. If we were to extrapolate on the response data from this year, in comparison to last year’s survey data, our readership is becoming more international and more secure, makes a tad more money, seems to be somewhat satisfied with its employment situation, and has fewer benefits. In addition, the survey results hint at a possible shift in attitudes toward work/life-balance issues.
The takeaway from this survey is that the fiscal reality for engineers today is stability and slight improvements, while many challenges remain. One survey respondent observed, “Things got much better, but I am still nowhere near where I was in 1999-2002.”
The job outlook, according to the Bureau of Labor Statistics, will be one of relative stability for engineers, in line with U.S. trends: “Overall employment of electrical and electronics engineers is projected to grow 7% from 2016 to 2026, about as fast as the average for all occupations. The change in employment is expected to be tempered by slow growth or decline in most manufacturing industries in which electrical and electronics engineers are employed.”1
As you already know, surveys are hardly an exact science. Factors affecting the salary survey results include readers’ level of participation, age, years on the job, education, and random factors that are not measurable.
The EE survey questionnaire, which was sent out to readers in May, elicited a 7% increase in responses, in comparison to last year. Following is the battery of questions for which many of our intelligent readers kindly contributed answers:
Where is your facility located?
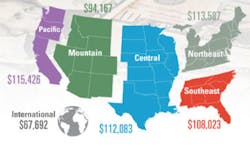
Employees in facilities from more than 40 of the 50 United States, California, and “International” topped the list at 15% each, up several percent from last year. Florida and Texas followed at 8% each.
Function
Design/development engineers dominated the results in this year’s survey, at 34%. Engineering/lab support came in second at 15%, and corporate management made a good showing at 14%.
What is your principal job responsibility?
Frontline engineers again rule the roost with a whopping 56% of responders, down only a percent from last year. Engineering managers followed with 27%, and general corporate management at 14%. University/Academia accounted for 1%.
What category best describes where you work?
Paydays apparently were sweeter this year for those in the power/energy area, with a $41,535 surge to $124,521. The semiconductors/component sector fared well also, with a $10k boost to $123,375 per year. Compensation for engineers in military/aerospace and industrial companies decreased slightly from last year to $119,241. It was a good year for those in wireless communications (up 4%) and computers (up 9%), and pulling in $112,620 and $94,130, respectively. Taking the biggest reported pay dips were wireline/fiber-optic communications, down $17k to $75,192; and consumer electronics, down $14k to $75,682.
Within the past year, have you had to gain additional job expertise?
A significant shuffle in job skill acquirement needs can be noted in relation to the Internet of Things, for which 33% gained expertise this year—up from 23% in 2017. Close behind were safety compliance at 28%, and RF/microwave communications at 25%. EMC/EMI compliance was another strong area of interest, at 23%.
If you have had to gain additional expertise, how did you go about it?
The No. 1 source that survey respondents used to gain additional job expertise: 53% consulted trade publications and associated websites, up last year from 51%. Webcasts/online events were at 43%, and books were at 41%. Only 30% gained expertise from in-person training sessions, and 25% utilized trade-show technical sessions. About 9% took classes at universities.
What personal electronic devices do you use for your work?
Android smart phones occupied the top of the heap at 41%, with the iPhone trailing at 35%. 15% employed iPads, while 14% used Android tablets. “Other smart phones” were reported by only 7% of respondents.
How many employees do you currently supervise?
Just over 36% of respondents do not supervise anyone. 33% oversee 1-5 employees, 10% supervise 6-10, and 9% manage more than 51 employees.
How many employees work in your entire company?
The biggest category, 28%, included companies with more than 10,000 employees, and not surprisingly, they report the highest wages—$126,576 . The second-largest group, 16%, had 101-500 employees, and the third largest group—at 15%—contained 1-10 employees. The smallest group, at 6%, worked in companies that have 51-100 employees, and earn an average salary of $89,028.
What is your highest level of education?
B.S.E.E.s were the largest group in our sample (26%,) with their yearly salaries averaging $101,667, which is just over a $6,000 drop from last year. In contrast, those with M.S.E.E. degrees (15%) pulled in $3,000 more than last year, with a reported salary of $112,085. Ph.D.s topped the money chart at $138,611, while respondents with only a high school diploma curiously out-earned many with college degrees, with earnings of $117,500—but note that they represent only 1.6% of this survey, and allegedly made $50k more than last year’s survey, which is highly questionable.
What is your primary source when you are looking for electronics-related information?
34% of survey respondents say they get their information from online sources, and 11% rely on magazine-related websites. 46% say they use all sources available.
How many years have you been employed in the industry?
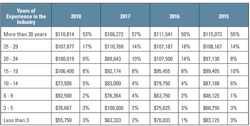
One of the more significant figures here is that 53% say they have worked in the industry for more than 30 years, and 17% say they have put in 25-29 years. What that heralds is the approaching departure, through retirement, of a majority of the engineering workforce—who are also the most experienced.
How long have you been with your current employer?
No major shifts here since last year. However, the largest category (26%) has worked for their present company for more than 25 years.
How satisfied are you with your job?
87% of responding readers say they are very or somewhat satisfied with their job. That is the same as the last survey.
How secure do you feel in your current position?
Feelings of security among engineers have remained fairly stable since last year, with 48% declaring that they are very secure in their employment situation.
What is your annual base salary (excluding bonuses and other incentive payments)?
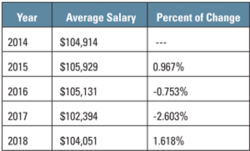
The average salary ticked upward to $104,051, compared to $102,394 last year.
Did your salary change in the past year?
More than 63% said they received an increase in their salaries. That is 5% more revealing pay raises than last year.
Did you receive a bonus as part of your compensation?
It was pretty close to a 50/50 chance that survey responders received a bonus.
What salary percentage increase have you received in the past year?
The largest group of answers, 36%, reported a 2-4% increase in compensation, with the next-largest segment, 26%, reporting they received nothing extra in their pay envelopes.
Please indicate the benefits your employer offers you.
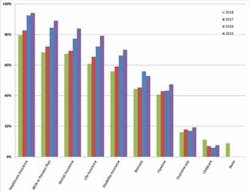
The numbers seem to confirm the erosion of benefits in the workplace in every category we polled, in values of 1-5%. Health and life insurance took the biggest hits, both down about 4%. 401Ks and pension plans declined 3.8%. The rest—dental, disability insurance, bonuses, flextime, and overtime—varied only 1-2% year-to-year. Our survey added an option for “none,” and 11% selected it.
Please tell us your gender
Out of our survey, 95% were male, 3% were female, and 3% preferred not to answer. The average male earned $105,222, and the average female earned $78,750.
Please tell us your age
The biggest contingent was the 46-55-year age group, at 39%, which earned an average of $109,921. The second-highest-paid segment, ages 36-45, took in $105,750. Close behind were the 56-65-year-olds, at $104,169. The smallest group (1%), those 18-25 years old, had an average salary of $83,333. In contrast, 3% of poll responders, at 25-36 years of age, made the least—$55,500. Some survey responders noted that the age-heavy engineering population poses challenges for the future. One reader noted, “In this industry it is becoming more important that young engineers learn from the experience of the older engineers. Many of us [in the] older generation hold skills they no longer teach or use, and this is creating a gap between what is a good idea … and what is a practical idea.”
In the past year, which of the following did your company do?
49% of companies were reported to have maintained their population of engineers. 38% hired more engineers, and 13% downsized their engineering staff. Only 32% added to staff according to our 2017 survey, which might account for the uptick in morale indicators this year.
What were your company’s approximate annual sales for 2017?
33% worked for companies that made more than $500 million in yearly sales. 36% were employed by firms that did less than $10 million or less in sales. 31% sold between $10 million and $500 million per year.
Please select the three career issues that are most important to you
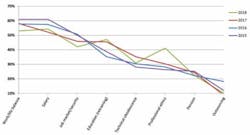
Though this survey is about money, the answers to this question might provide more insight into the life of an engineer. Salary received a 54% vote, while work/life balance pulled a 53% response. There was a 6% gap between those categories last year, and work/life balance was at 58%. Maybe the pursuit of money has become more of a factor in a tightening economy. Also, 64% of responding engineers are age 56 and older. As one reader observed, “Being later in my career, salary is a very important part in preparing for retirement.” Another subscriber put it bluntly: “Engineering professionals are not adequately compensated.” That sentiment was echoed by another professional: “Looking upon the idea of pay … I myself have become so specialized in what I do no company is willing to pay for the experience or level of training that I am paid—less than what is quoted here.”
Angst over education/retraining increased 1.6% this year. Worries about obsolescence and outsourcing also advanced. Other subjects of concern—job market/security, and pensions—declined slightly.
Some readers took advantage of the comments section to voice their disdain for the engineering world in general. One reader quipped, “Age discrimination is rampant. They won’t pay you for your experience, they’d rather hire a new graduate. If you want a job and you’re over 40, you take whatever job they offer you, and take whatever pay they offer you. There is no future in engineering. You may start out at a pay higher than other college graduates, but then you suffer salary compression the rest of your career, frequent layoffs, and you never get vested in the 401k plan company match.”
Negative sentiments were mostly balanced by readers who were very pleased with their work lives. One reader, seizing a Mel Brooks quote, quipped, “It’s good to be the king.”EE
Reference
1. BLS Occupational Outlook Handbook

