Download this article in .PDF Format.
All in a day's work
Welcome to Evaluation Engineering’s 2019 Job Report. Up until this year, we branded this report as the results of our annual “Salary Survey”. But when revisiting all that our survey covers, it’s far more than salary information—encompassing many factors that go into our readers’ job function and, compensation, and overall job satisfaction. That’s why we’ve decided to rebrand this feature as EE’s Job Report going forward, based on the results of the aforementioned survey that was open from early May through June.
Besides the name change, another big difference this year is that, for the first time, we have divided the survey results based on four job titles—Engineer, Manager, C-Level Executive, and Other/Retired/Scientific/Academia. Whereas previous years’ reports pooled the results of all questions with all respondents, the vast majority of this year’s survey results will compare engineers only against other engineers, managers only against other managers, and so on. Doing so hasresulted in data that we think is much more valuable to our readers, rather than—for example—averaging the salary of a small company engineer against that of a large company CEO.
Given those changes for this year, we’re always open to future tweaks that will improve our survey and its resulting report. If you have any suggestions, please email them to Editor-in-Chief Mike Hockett at [email protected]. Some of you already gave your suggestions in the open-ended question we ended our survey with. That final question at the end of this report allowed respondents to vent their thoughts about their salary and compensation level, which produced quite a lot of good commentary you won’t want to miss.
We at EE thank you to everyone who completed our survey, and hope you enjoy perusing the results.
Demographics
As previously stated, we’ll break down the results of our survey questions by four job titles, but here are the results of a few demographic questions that are worth applying to all respondents.
Location: To no surprise, the most popular state our respondents’ primary facility resides in is California, at 12.7% of our total. Texas was second at 11.2%, followed by Michigan at 6.5%, New York at 5.8%, Florida and Illinois each at 3.9%, and Massachusetts and Ohio each at 3.5%, while 5.4% of our respondents are located outside of the U.S.
Gender: Of those who selected a gender, an even 94% of our respondents picked male.
Company headcount: More than half of our respondents work at large companies, with 31.5% saying their company has more than 10,000 employees, and 24.6% are at companies with between 1,001 and 10,000 employees.
5.8% of respondents say their company employees 501 to 1,000 people
16.9% work at companies with 101 to 500 employees
10.4% work at a company that has 11 to 50 employees
6.2% of respondents work at a company that has 1 to 10 employees
Company sales: Just over 43% of our respondents say their company’s approximate 2018 full-year sales were greater than $500 million.
17.7% say their company had between $50.1 million and $500 million in sales
18.9% say their company had between $10.1 million and $50 million in sales
11.5% say their company had between $1.1 million and $10 million in sales
8.9% say their company had less than $1 million in sales
Job vertical: Asked which vertical best describes where they work, 21.2% of our respondents chose Military/Aerospace, followed by Industrial at 13.5% and Automotive/Transportation at 13.1%. Respondents could pick from 13 options, with the other popular picks including Power/Energy (9.2%), Other (8.9%), Semiconductors/Components (6.9%), and Contract Design/Manufacturing (6.2%).
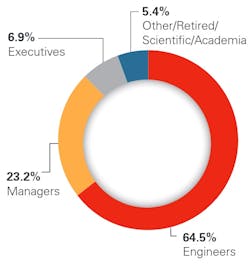
Job title: As expected, the vast majority of our respondents—64.5%—are front-line Engineers, encompassing non-managerial functions such as testing, product/quality assurance, production, design, research & development, field service, or lab support. A little less than one-fourth—23.2%—of respondents have Managerial titles (product manager, non-executive vice president, corporate manager, etc.). Nearly 7% of respondents have C-Level Executive titles (owner, chairman, president, CEO, CFO, CIO, COO, EVP, etc.), while 5.4% of respondents’ title falls under one of Other, Retired, or Scientific/Academia.
Now, on to the rest of the survey results, segmented by job title.
Unless noted, percentages are rounded to the nearest 1/10th decimal point. For Managers, Executives, and Other/Retires/Scientific/Academia, only results with a sufficient number of entries are shown. Thus, total percentages won't add up to 100.0% under each job title.
1. Within the past year, in what areas have you had to gain additional expertise?
(Select any)
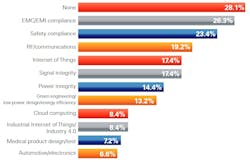
None - 28.1%
EMC/EMI compliance - 26.3%
Safety compliance - 23.4%
RF/communications - 19.2%
Internet of Things - 17.4%
Signal integrity - 17.4%
Power integrity - 14.4%
Green engineering/low-power design/energy efficiency - 13.2%
Cloud computing - 8.4%
Industrial Internet of Things/Industry 4.0 - 8.4%
Medical product design/test - 7.2%
Automotive/electronics - 6.6%
Managers:
Safety compliance - 53.3%
RF/Microwave communications - 21.7%
EMC/EMI compliance - 20.0%
Internet of Things - 18.3%
Industrial Internet of Things, M2M, Industry 4.0 - 16.7%
None - 16.7%
Power integrity - 11.7%
Signal integrity - 8.3%
Automotive electronics (radar, V2X) - 6.7%
Fog computing - 6.7%
Executives:
Safety compliance - 33.3%
RF/Microwave communications - 27.8%
EMC/EMI compliance - 27.8%
Internet of Things - 27.8%
None - 22.2%
Signal integrity - 16.7%
Other/Retired/Scientific/Academia:
Internet of Things - 50.0%
None - 28.6%
2. If you have had to gain additional expertise, how did you go about it?
(Select any)
Engineers:
Sponsored webcasts/online events - 48.5%
Trade publications & associated websites - 47.9%
Books - 33.5%
In-person training provided by a vendor - 32.9%
Trade show technical sessions & presentations - 20.4%
Not applicable - 16.2%
Online classes at a university - 13.2%
Other - 7.2%
In-person classes at a university - 6.6%
Managers:
Trade publications and associated websites - 43.3%
In-person training sessions provided by a vendor - 38.3%
Webcasts/online events sponsored by a company or professional organization - 33.3%
Trade show technical sessions and presentations - 30.0%
Books - 25.0%
In-person classes at a university - 18.3%
Other - 10.0%
N/A - 10.0%
Executives:
Trade publications and associated websites - 50.0%
Trade show technical sessions and presentations - 38.9%
Webcasts/online events sponsored by a company or professional organization - 27.8%
Online Classes at a university - 27.8%
Books - 27.8%
In-person training sessions provided by a vendor - 27.8%
In-person classes at a university - 22.2%
Other/Retired/Scientific/Academia:
Books - 42.9%
Trade publications and associated websites - 28.6%
Webcasts/online events sponsored by a company or professional organization - 28.6%
Not applicable - 28.6%
3. What electronic devices do you use for your work?
(select any)
Engineers:
Android smartphone - 37.1%
iPhone - 33.5%
None - 29.9%
iPad - 10.8%
Android tablet - 9.6%
Surface tablet - 2.4%
Other smartphone - 2.4%
Other tablet - 1.2%
Managers:
iPhone - 58.3%
Android smartphone - 41.7%
iPad - 25.0%
Surface tablet - 16.7%
Android tablet - 10.0%
Other tablet - 8.3%
Blackberry - 6.7%
Executives:
iPad - 44.4%
Android smartphone - 44.4%
iPhone - 38.9%
Surface tablet - 38.9%
Android tablet - 22.2%
Blackberry - 11.1%
Other/Retired/Scientific/Academia:
Android smartphone - 35.7%
None - 35.7%
4. How many employees do you currently supervise?
Engineers:
1 to 5 - 26.9%
6 to 10 - 5.4%
11 to 50 - 3.0%
More than 50 - 3.0%
None - 61.1%
Managers:
1 to 5 - 20.0%
6 to 10 - 38.3%
11 to 50 - 33.3%
Executives:
None - 11.1%
1 to 5 - 22.2%
6 to 10 - 11.1%
11 to 50 - 27.8%
More than 51 - 27.8%
Other/Retired/Scientific/Academia:
6 to 10 - 21.4%
None - 71.4%
5. How many employees work in your entire company?
Engineers:
1 to 10 - 3.0%
11 to 50 - 5.4%
51 to 100 - 3.6%
101 to 500 - 14.4%
501 to 1,000 - 6.6%
1,001 to 10,000 - 28.7%
More than 10,000 - 37.7%
Managers:
11 to 50 - 21.7%
101 to 500 - 25.0%
501 to 1,000 - 6.7%
1,001 to 10,000 - 15.0%
More than 10,000 - 23.3%
Executives:
1 to 10 - 33.3%
11 to 50 - 22.2%
51 to 100 - 11.1%
101 to 500 - 11.1%
More than 10,000 - 22.2%
Other/Retired/Scientific/Academia:
101 to 500 - 21.4%
1,001 to 10,000 - 50.0%
6. What is your highest level of education?
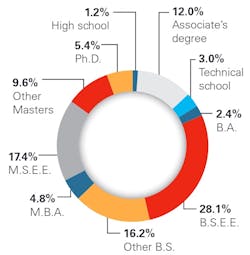
High school - 1.2%
Associate’s degree - 12.0%
Technical school - 3.0%
B.A. - 2.4%
B.S.E.E. - 28.1%
Other B.S. 16.2%
M.B.A. - 4.8%
M.S.E.E. 17.4%
Other Masters - 9.6%
Ph.D. - 5.4%
Managers:
Associate's degree(s) - 11.7%
B.S.E.E. - 21.7%
Other B.S. - 18.3%
M.B.A. - 11.1%
M.S.E.E. - 13.3%
Other Masters - 18.3%
Executives:
Associate's degree(s) - 5.5%
B.A. - 16.7%
B.S.E.E. - 11.1%
Other B.S. - 16.7%
Ph.D. - 27.8%
Other/Retired/Scientific/Academia:
B.S.E.E. - 21.4%
Other B.S. - 21.4%
Ph.D. - 28.6%
7. What is your primary source when you are looking for electronics-related information?
Engineers:
Online sources - 45.5%
All of the above - 44.3%
Websites for magazines & publications - 6.0%
Printed magazines & publications - 1.8%
Professional associations/organizations - 1.8%
Managers:
All of the above - 33.3%
Online sources - 38.3%
Websites for magazines and publications - 11.7%
Printed magazines and publications - 6.7%
Professional associations and/or organizations - 6.7%
Executives:
All of the above - 22.2%
Online sources - 38.9%
Printed magazines and publications - 38.9%
Other/Retired/Scientific/Academia:
All of the above - 21.4%
Online sources - 50.0%
8. How many years have you been employed in the industry?
Engineers:
Less than 3 years - 3.6%
3 to 5 years - 3.0%
6 to 9 years - 6.0%
10 to 14 years - 8.4%
15 to 19 years - 9.6%
20 to 24 years - 20.2%
25 to 29 years - 8.4%
More than 30 years - 53.9%
Managers:
3 to 5 years - 5.0%
15 to 19 years - 10.0%
25 to 29 years - 18.3%
More than 30 years - 60.0%
Executives:
15 to 19 years - 16.7%
More than 30 years - 61.1%
Other/Retired/Scientific/Academia:
15 to 19 years - 21.4%
More than 30 years - 50.0%
9. How long have you been with your current employer?
Engineers:
Less than 3 years - 15.6%
3 to 5 years - 9.0%
6 to 9 years - 13.2%
10 to 14 years - 10.2%
15 to 19 years - 16.2%
20 to 24 years - 11.4%
More than 25 years - 24.6%
Managers:
3 to 5 years - 15.0%
6 to 9 years - 23.3%
10 to 14 years - 10.0%
15 to 19 years - 10.0%
20 to 24 years - 11.7%
More than 25 years - 28.3%
Executives:
10 to 14 years - 27.8%
15 to 19 years - 16.7%
More than 25 years - 44.4%
Other/Retired/Scientific/Academia:
6 to 9 years - 21.4%
More than 25 years - 35.7%
10. How satisfied are you with your job?
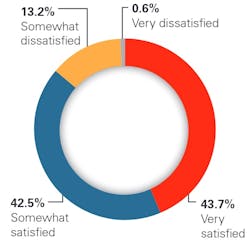
Very satisfied - 43.7%
Somewhat satisfied- 42.5%
Somewhat dissatisfied - 13.2%
Very dissatisfied - 0.6%
Managers:
Very satisfied - 35.0%
Somewhat satisfied - 46.7%
Somewhat dissatisfied - 15.0%
- Very dissatisfied - 3.3%
Executives:
Very satisfied - 61.1%
Somewhat satisfied - 33.3%
- Very dissatisfied - 5.5%
Other/Retired/Scientific/Academia:
Very satisfied - 64.3%
Somewhat satisfied - 21.4%
- Somewhat dissatisfied - 7.1%
- Very dissatisfied - 7.1%
11. How secure do you feel in your current position?
Engineers:
Very secure - 38.9%
Somewhat secure - 47.3%
Somewhat insecure - 10.8%
- Very insecure - 3.0%
Managers:
Very secure - 48.3%
Somewhat secure - 38.3%
Somewhat insecure - 10.0%
Very insecure - 3.3%
Executives:
Very secure - 72.2%
Somewhat secure - 22.2%
- Very insecure - 5.5%
Other/Retired/Scientific/Academia:
Very secure - 64.3%
Somewhat secure - 28.6%
- Very insecure - 7.1%
12. In the past year, did the number of engineers at your company change?
Engineers:
Company hired more engineers - 45.5%
Company downsized engineers - 40.1%
Company downsized engineers - 14.4%
Managers:
Company hired more engineers - 51.7%
Company maintained same number of engineers - 48.3%
Executives:
Company hired more engineers - 50.0%
Company maintained same number of engineers - 50.0%
Other/Retired/Scientific/Academia:
Company hired more engineers - 35.7%
Company maintained same number of engineers - 35.7%
Company downsized engineers - 28.5%
13. What is your annual base salary?
(excluding bonuses and other incentive payments)
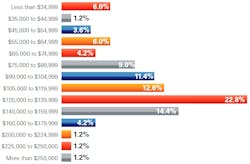
Less than $34,999 - 6.0%
$35,000 to $44,999 - 1.2%
$45,000 to $54,999 - 3.6%
$55,000 to $64,999 - 6.0%
$65,000 to $74,999 - 4.2%
$75,000 to $89,999 - 9.0%
$99,000 to $104,999 - 11.4%
$105,000 to $119,999 - 12.6%
$120,000 to $139,999 - 22.8%
$140,000 to $159,999 - 14.4%
$160,000 to $179,999 - 4.2%
$200,000 to $224,999 - 1.2%
$225,000 to $250,000 - 1.2%
More than $250,000 - 1.2%
Average salary: $112,650
Managers:
Less than $34,999 - 1.7%
$35,000 to $44,999 -1.7%
$45,000 to $54,999 -8.3%
$55,000 to $64,999 - 3.3%
$75,000 to $89,999 - 3.3%
$90,000 to $104,999 - 11.7%
$105,000 to $119,999 - 10.0%
$120,000 to $139,999 - 13.3%
$140,000 to $159,999 - 18.3%
$160,000 to $179,999 - 13.3%
$200,000 to $224,999 - 8.3%
$225,000 to $250,000 - 3.3%
More than $250,000 - 3.3%
Average salary: $135,800
Executives:
$120,000 to $139,999 - 16.7%
$140,000 to $159,999 - 16.7%
More than $250,000 - 27.8%
5 salary ranges each with 5.5%
Average salary: $173,222
Other/Retired/Scientific/Academia:
Less than $34,999 - 14.3%
$90,000 to $104,999 - 35.7%
7 salary ranges each with 7.1%
Average salary: $103,464
Average salary by job title
14. Did your salary change in the last year, and how?
Engineers:
Increased - 74.9%
Decreased - 0.6%
Stayed the same - 24.6%
Managers:
Increased - 78.3%
Decreased - 1.7%
Stayed the same - 20.0%
Executives:
Increased - 38.9%
Decreased - 11.1%
Stayed the same - 50.0%
Other/Retired/Scientific/Academia:
Increased - 64.3%
Decreased - 7.1%
Stayed the same - 28.6%
15. What salary percentage increase have you received in the last year?
Engineers:
Greater than 10% - 2.4%
8 to 10% - 2.4%
5 to 7% - 4.2%
2 to 4% - 53.3%
Less than 2% - 19.2%
None - 18.0%
Managers:
Greater than 10% - 3.3%
8 to 10% - 6.7%
5 to 7% - 21/7%
2 to 4% - 43.3%
Less than 2% - 6.7%
None - 18.3%
Executives:
Greater than 10% - 11.1%
5 to 7% - 22.2%
2 to 4% - 11.1%
None - 38.9%
Other/Retired/Scientific/Academia:
2 to 4% - 42.3%
Less than 2% - 21.4%
None - 28.6%
16. Did you receive a bonus as part of your compensation?
Engineers:
Yes - 53.3%
No - 46.7%
Managers:
Yes - 76.7%
No - 23/3%
Executives:
Yes - 50.0%
No - 50.0%
Other/Retired/Scientific/Academia:
Yes - 35.7%
No - 64.3%
17. What benefits does your employer offer?
(Select all that apply)
Engineers:
Healthcare insurance - 93.4%
401k or pension plan - 86.8%
Dental insurance - 85.0%
Life insurance - 77.2%
Disability insurance - 74.3%
Bonuses - 52.1%
Flextime - 48.5%
Overtime pay - 18.6%
Childcare - 7.8%
None - 3.0%
Managers:
Healthcare insurance - 98.3%
Dental insurance - 91.7%
Disability insurance - 71.7%
401k or pension plan - 90.0%
Life insurance - 81.7%
Bonuses - 73.3%
Flextime - 51.7%
Overtime pay - 21.7%
Childcare - 13.3%
Executives:
Healthcare insurance - 66.7%
Dental insurance - 61.1%
Disability insurance - 27.8%
401k or pension plan - 50.0%
Life insurance - 50.0%
Bonuses - 50.0%
Flextime - 22.2%
None - 22.2%
Other/Retired/Scientific/Academia:
Healthcare insurance - 57.1%
401k or pension plan - 57.1%
Dental insurance - 50.0%
Life insurance - 50.0%
Disability insurance - 35.7%
18. What is your gender?
(results of those who selected male or female)
Engineers:
Male - 93.8%
Female - 6.3%
Managers:
Male - 85.0%
Female - 8.3%
Executives:
Male - 100.0%
Other/Retired/Scientific/Academia:
Male - 100.0%
19. What is your age?
(results of those who picked an age range)
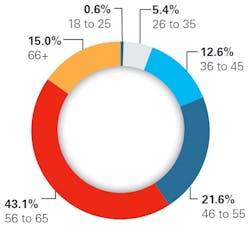
18 to 25 - 0.6%
26 to 35 - 5.4%
36 to 45 - 12.6%
46 to 55 - 21.6%
56 to 65 - 43.1%
66+ - 15.0%
Managers:
26 to 35 - 8.3%
36 to 45 - 15.0%
46 to 55 - 23.3%
56 to 65 - 40.0%
66+ - 10.0%
Executives:
36 to 45 - 27.8%
46 to 55 - 22.2%
56 to 65 - 16.7%
66+ - 27.8%
Other/Retired/Scientific/Academia:
18 to 25 - 7.1%
26 to 35 - 7.1%
36 to 45 - 7.1%
46 to 55 - 21.4%
56 to 65 - 14.3%
66+ - 42.9%
20. What career issues are most important to you?
(Select three)
Engineers:
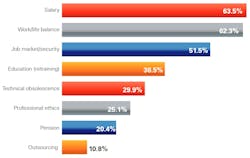
Salary - 63.5%
Work/life balance - 62.3%
Job market/security - 51.5%
Education (retraining) - 36.5%
Technical obsolescence - 29.9%
Professional ethics - 25.1%
Pension - 20.4%
Outsourcing - 10.8%
Managers:
Work/life balance - 61.7%
Salary - 51.7%
Professional ethics - 48.3%
Job market/security - 45.0%
Technical obsolescence - 26.7%
Pension - 25.0%
Outsourcing - 11.7%
Executives:
Professional ethics - 50.0%
Education (retraining) - 44.4%
Salary - 44.4%
Technical obsolescence - 38.9%
Work/life balance - 38.9%
Job market/security - 33.3%
Pension - 33.3%
Outsourcing - 16.7%
Other/Retired/Scientific/Academia:
Work/life balance - 71.4%
Education (retraining) - 64.3%
Job market/security - 50.0%
Technical obsolescence - 42.9%
Salary - 35.7%
Pension - 21.4%
Please share any comments with us regarding your thoughts on your salary or compensation
Engineers:
“As much knowledge as I have to keep up-to-date, and continue training, I would expect more compensation. I get companies and recruiters contacting me continually, but the compensation they offer is low in my opinion. Companies want many skills, but they don't want to pay significantly more for those skills. I am planning a career change to less demanding work.”
“Haven't made it back to my starting salary in 2007 at a previous employer (layoff after 7 years). The benefits here exist (on paper) but absolutely don't qualify as benefits in my eyes. I use my wife's benefits. When she retires, I will need to find another job immediately.”
“After creating new positions to boost management salaries, the remaining scraps are distributed amongst the employees. Same MO every year.”
“I keep hearing the aerospace industry complain there is not enough talent, and then they show hundreds of engineers the door, especially experienced engineers. What these executives really mean is they want ‘cheap’ talent. An engineer that is over 50 is not considered an asset to the organization. Age discrimination is still alive and well.”
“Even though we are starting to lose engineers to other area companies for higher salaries, our company does not work to match or exceed the offers they are getting to keep the people here, when, most of the time they should, due to tribal knowledge that they have.”
“I think the salary I make is reasonable for my years of experience and level of education. Would like to see a bonus every now and then if cost savings for the customer have been provided, but understandable that it may not happen if on a firm fixed contract.”
“Our company keeps saying that our financials are the best-ever for the last 2 years, but our bonuses keep going down each year and we don't get raises!”
“Company needs to be more consistent in their hiring compensations and promotions. Some groups in the company hand out promotions (and thus higher increments) like candy, but other teams are so stingy in advancing people that many get frustrated and leave.”
“I feel that, in general, engineers are under-compensated with regard to their importance to the growth of the company and its source of profits. I see way too many managers that do not have a real clue as to how products work and should be designed, or have regard for what I consider the integrity of the business. The goals are ‘get it to the market, even if it’s not fully baked. Make the month, make the quarter, make the year.’ It should be to make the customer happy, as that is the way to future growth.”
Managers:
“I'm earning less now then I was 8 years ago when I started with this company and receiving half the benefits. I contribute this to: being female, the recession, deteriorating work ethics, an employer who doesn't know the meaning of equal treatment or fairness, and lack of available skilled employees.”
“I am in the age bracket where salary increases are not common. Our younger engineers are being rewarded for their contributions and are being provided with more challenging opportunities and more responsibility. For a small company, I believe we are being treated fairly and compensated reasonably well.”
“As I am nearing retirement, I do not expect to see any compensation action. Our younger employees are rewarded for their contributions, and to-date, our attrition rate is low.”


