2019 Was Down! Will 2020 See a Chip Recovery?
As 2019 winds up we can look back on a year that was very difficult for the semiconductor industry, in particular for manufacturers of NAND flash and DRAM. The big question for these companies is now: Will 2020 be any better? Let’s have a look at what the current market conditions and what a lot of chip history can tell us about how the year is likely to turn out.
Don’t get me wrong. Although chip makers are suffering, the market’s not bad for everyone. Those OEMs who suffered from sky-high DRAM prices in 2018 were thrilled to get some price relief in 2019. These OEMs also need to know the 2020 outlook: Will today’s respite from high prices last, or are chip prices about to return to unbearable heights?
2019 At-A-Glance
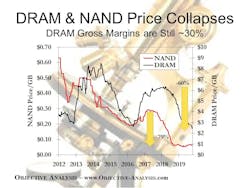
The chart (Fig. 1) illustrates spot market prices for DRAM and NAND flash for the past couple of years.
These prices are important to anyone in the semiconductor community, even those who neither make nor use DRAM or NAND flash, because they are the drivers of the market’s notorious revenue swings. (More on this later.)
NAND flash prices, shown with the red line and measured on the left vertical axis, began to tumble in early 2018, and by the middle of this year they had dropped 79% from their 2017 peak to flatten out at cost. DRAM prices, illustrated with the black line, and measured on the right vertical axis, climbed in 2018 but began to collapse late in the year. By December they had fallen 60%.
The net result of these price falls is that 2019 DRAM revenues are likely to be down by 41% once 2019 has been tallied up, and NAND flash revenues will be found to have fallen by 18%. These two are big contributors to the 12% total semiconductor revenue decline that 2019 is likely to be remembered for once the year’s books have been closed.
A Solid Methodology
How can we use this kind of information to predict future market trends? Objective Analysis employs a relatively straightforward methodology to predict semiconductor market upturns and downturns. Although length limitations prevent my providing all of the details in this article, our model essentially predicts the timing of shortages and oversupplies based on the capital spending that occurred two years prior, and predicts prices based upon historical price behavior and a production cost model.
This has been the basis for our forecast for the past 12 years, and it has allowed us to deliver the most consistently-accurate semiconductor forecasts in the industry. Our prior forecast performance can be reviewed on our website at http://Objective-Analysis.com/forecast-accuracy.
Looking Forward
Where does the market go from here?
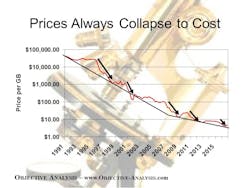
If we look back at DRAM prices over the past 29 years we can see a pattern that should repeat itself during the current downturn. The chart (Fig. 2) compares DRAM price per gigabyte (red line) to an approximation of cost (black line) since 1991. When there’s a shortage price and cost diverge making the market profitable. Once the market turns from a shortage to an oversupply then prices collapse to cost.
NAND flash prices have already collapsed to cost and DRAM is currently involved in the later stages of its own price collapse.
DRAM prices, though, have not yet reached cost – they still generate about a 30% gross margin. Objective Analysis expects to see further DRAM price decreases that will bring prices down to costs by the end of 2019 or early in 2020. We estimate that the production cost of a gigabyte of DRAM is around $1.80, and today’s lowest spot market price is around $2.45.
Capital Spending’s Role
Something interesting always happens when there’s a shortage and semiconductor manufacturers are profitable: They all simultaneously invest in additional production capacity. This phenomenon happened when DRAM prices were high in 2018, and when NAND flash prices peaked in 2017. The market’s profitability drives semiconductor cycles. Here’s how.
The relationship between capital expenditures (“CapEx”) and market profitability is pretty tight: Two years after a CapEx surge the market enters an oversupply and prices collapse to cost. Profits vanish and CapEx is cut. Two years after a CapEx cut the market enters a shortage, prices stabilize, and profits return.
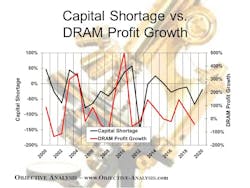
We illustrate this relationship on the chart (Fig. 3). The chart plots a black “Capital Shortage” line (measured on the left axis) over a red “DRAM Profit Growth” line, measured on the right axis.
The “Capital Shortage” line is derived from CapEx two years prior.
While there’s a clear relationship, the reader can easily find points where the two lines don’t move in tandem. As a general rule, though, the black line is a pretty good indicator of where the red line is headed. The fact that the black line increases in 2020 indicates that DRAM profits should return and that the Objective Analysis 2020 semiconductor forecast could rationally predict growth for 2020.
There are times, though, when a forecaster must look at other factors to determine how the market is most likely to evolve. This is one of those times.
There is still a significant NAND flash and DRAM oversupply, and the industry gives us no reason to expect for that oversupply to abate over the course of 2020. 2018’s CapEx was so extreme that it’s unrealistic to expect for a shortage to return that soon. This drives our outlook to be flat to negative for 2020.
Our 2020 Forecast
Objective Analysis predicts that total semiconductor revenues will see zero growth at best, with the strong possibility of a mild revenue decline. Although NAND flash revenues should grow about 5%, based upon an assumption of stable bit growth and prices following cost, DRAM revenues are most likely to decline by 25% as prices continue their collapse and bit growth runs at a slower pace than NAND’s. Although other semiconductors will see modest growth, their growth will be insufficient to offset DRAM’s decline.
We provide a more detailed forecast to our regular clients. Please contact us if you would like to learn more.
About the Author


