Some low-dropout regulators (LDOs) use multiple feedback loops to improve output voltage transient response. In many of these cases, some or all of the loops are inside the IC. Accessing these loops is then impossible, or there isn’t a single accessible point that includes all of the loops. Designers can assess the stability of regulators like Linear Technology’s LT1573 and Texas Instruments’ TPS7H1101 multiple-loop LDOs by using the non-invasive stability measurement capability of the OMICRON Lab Bode 100 vector network analyzer (VNA).1 This article focuses on the TPS7H1101.
Multiple Loops
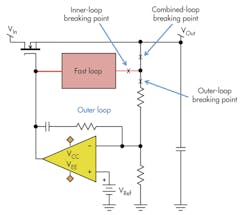
The simplified schematic in Figure 1shows traditional error amplifier feedback along with a second loop that connects some function of the output voltage directly to the pass transistor drive. In fact, three loops are present: the “fast” loop, the feedback loop, and the combined loop. The second and combined loops often are not accessible for external measurement.
Related Articles
- LDO Embodies Novel Features For Industrial Apps
- Low-Dropout (LDO) Linear Regulators
- Basic Analysis And Evaluation Of Low-Dropout Regulators
Each feedback loop contributes to the overall regulator stability, so they all should be included in the stability margin assessment. This would be the case if the combined loop could be measured. Since there is no external place to break the combined loop for a Bode plot measurement, which is the only method available to us, we need to use the non-invasive stability measurement to get an exact assessment.2
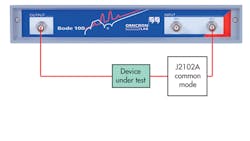
The data for this test is generally derived from the output impedance, which is measured using a 50-Ω VNA in a two-port shunt-through configuration (Fig. 2).3,4 The regulator in this example has a very low output voltage so its output can be connected directly to the VNA. For output voltages above 3.3 V, the VNA must be capacitively coupled to the regulator.
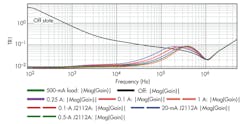
Figure 3 shows the output impedance results at several load conditions and also with the regulator unpowered. The measurement with the regulator off is a measurement of the output capacitor.
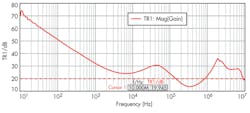
The non-invasive measurement, which is available in the OMICRON Lab Bode 100 as a simple cursor measurement on the output impedance waveform, is used to measure the phase margin of the regulator at 500 mA. The result of this cursor measurement indicates a phase margin of 58.86° at this operating current (Fig. 4). The test is termed “non-invasive” because the recording of the output impedance by the VNA does not disturb or load the output impedance that is being measured. This makes the measurement perfect for in-system testing where cuts or jumpers may be difficult to make.
A published relationship between open-loop series Q and phase margin allows a conversion from phase margin to Q or from Q to phase margin.5 This established relationship is used to create L-C-R networks with several values of phase margin for visual comparison with a step load measurement. The relationship used to transform phase margin, ø, is:
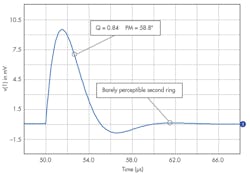
The Q for a 58.8° phase margin is 0.84. Figure 5 illustrates a simulation of the transient response for this value of Q.
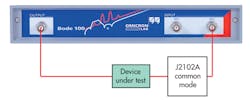
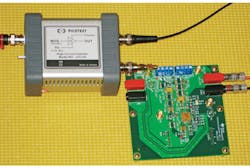
The regulator is connected to a Picotest J2112A current injector through a very short surface-mount assembly (SMA) adapter (Fig. 6). The J2112A presents a much higher impedance and a much faster edge than a traditional electronic load, which would not be able to generate the proper stimulus.
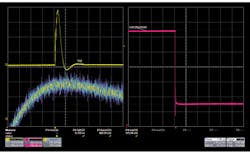
Figure 7 shows the step load result. The step load response is shown in the yellow trace seen in the upper left corner. The current step is shown in the pink trace on the right. A zoomed section of the transient response is shown in color persistence in the lower left corner. Note the barely perceptible second ring, consistent with the 58.8° simulation. The barely perceptible second ring characteristic seen in the 58.8° simulation is also evident in this measurement, confirming the result. The 7-ns current step from the J2112A is shown as well.
Conclusion
Since we cannot measure the stability of most multiple-loop regulators using a Bode plot, we must use the non-invasive phase margin measurement. The simulations, developed from an established, published source, can be used to simulate the step load response that results from a 58.8° phase margin. The barely perceptible second ring, used as a key comparison point between the measured result and the simulation result, are in very close agreement confirming the 58.8° reported by the non-invasive measurement. The non-invasive measurement is accurate, direct, simple, and inexpensive to make.
References
1. “New Technique for Non-Invasive Testing of Regulator Stability,” Steven Sandler and Charles Hymowitz, AEi Systems, Power Electronics Technology, September 2011, http://powerelectronics.com/power-electronics-systems/new-technique-non-invasive-testing-regulator-stability
2. “Making Invasive and Non-Invasive Stability Measurements Using the Bode 100 and the Picotest J2111A Current Injector,” Florian Hämmerle, Steve Sandler, Picotest Application Note, 4/9/2012.
3. Agilent 5989-5935 Ultra-Low Impedance Measurements Using 2-Port Measurements,
cp.literature.agilent.com/litweb/pdf/5989-5935EN.pdf
4. Steven M. Sandler, “How to Measure Ultra-Low Impedances,” Electronic Design, June 15, 2012, http://electronicdesign.com/boards/how-measure-ultra-low-impedances
5. R.W. Erickson, D. Maksimović, Fundamentals of Power Electronics 2nd ed., Springer, 2001
Steve Sandler is the founder and the president of Picotest and the chief engineer of AEi Systems LLC. At Picotest, he is responsible for the development of the Signal Injector product line.
About the Author
Steve Sandler
Steve Sandler is the founder and chief engineer of AEi Systems LLC and the president of Picotest. At Picotest he is responsible for signal injector product development, as well as the overall operation of the test equipment company.
