This file type includes high-resolution graphics and schematics when applicable.
Admittedly, I have biases. For one, I’m partial to Italian food and the occasional Japanese sashimi. I’m also biased regarding the deployment modes of hardware emulation. I’m not fond of the in-circuit-emulation (ICE) mode, an opinion I have expressed in numerous writings.
For the record, the ICE mode has been historically the first method of deployment of hardware emulators. In this mode, the emulator is plugged into a socket on the physical target system in place of a yet-to-be-built chip to support exercising and debugging the design under test (DUT) mapped inside the emulator with live data.
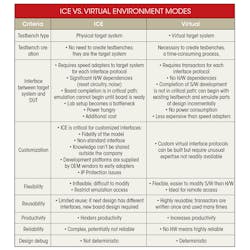
Instead of ICE mode, I favor a deployment in a virtual environment mode with a software-based test environment. It’s written at a higher level of abstraction than the register transfer level (RTL), in place of the physical target system (see table).
For once, let me give Caesar his dues, a popular Italian expression. Or, let’s give the devil his due, the more common phrase in the U.S. Clearly, the most dramatic benefit of ICE is the ability to exercise the DUT with real traffic, thus avoiding the time-consuming and possibly error-prone creation of the testbench. Let the real world do the job, thoroughly and quickly. Supposedly, the real world is better at finding nasty bugs dormant in obscure design areas than any software-based testbench.
Another uniqueness of ICE rests on the ability to support custom and proprietary interfaces to the target system based on highly confidential IP contents that the end user of emulation would never disclose to the outside world. Contrast this to creating and debugging a testbench. If something goes wrong, the designer always ends up asking: “Is this a testbench bug or a design bug?” Obviously, debugging a testbench stretches the overall time allocated to the verification task, which is never enough.
The ICE verification method comes with a bag of issues, most of which stem from the hardware nature of the approach. Among them are lack of flexibility, limited reusability, potential unreliability, and several inconveniences affecting its deployment. Not to mention additional cost and power consumption that are reduced or flat out eliminated by a virtual approach.
One issue stands out above all: Lack of deterministic or repeatable behavior when debugging the DUT.
Design Debug
Design debugging is a quest that cannot be planned ahead. That’s because bugs show up unexpectedly in an unknown location, at an unknown time, due to an unknown cause.
When applied to system-on-chip (SoC) designs of hundreds of million gates that encompass vast amounts of embedded software, the debugging process requires long sequences. These sequences can run into several millions, if not billions, of verification cycles to unearth some bugs, whether in hardware or software, sitting deep in unknown corners of the design.
In these instances, the three critical unknowns—location, time, and cause—can considerably delay the schedule of even the most well-thought-out test plan. Bear in mind that a one-month delay in the schedule of a new product with a lifecycle of 24 months in a highly competitive market will cut around 12% off its total potential revenues. And if the lifecycle is 12 months, say for a modern smartphone, the potential loss expands dramatically to about 25% or a quarter of the total revenues.
The potential loss is large enough to justify the most expensive verification solution.
Hardware emulation is the best choice for the mission. The extremely fast performance of emulators accelerates execution and debugging time by several orders of magnitude compared to hardware-description-language (HDL) simulators. In fact, their speedy execution was the reason for devising them. They can zoom quickly on an area where a design bug is suspected of hiding, even after processing a billion cycles.
And although expensive compared to software-based verification solutions, they are still the least expensive verification engines on a per-verification-cycle basis.
ICE Debug Issues
However, debugging a chip design in ICE mode is cumbersome and frustrating. That’s due to lack of deterministic, predictable behavior of the physical target system, which compromises and prolongs the finding of a bug.
Tracing a bug in the DUT with hardware emulators requires capturing the activity of each design register in a trace memory, at full speed, triggered on specific events. The trace memory has limited capacity, allowing for a waveform depth of millions of cycles, which is rather small when compared to a full run of billions of cycles.
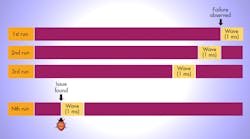
As a result, the user ends up making multiple runs—possibly in the hundreds—to find the debugging window of interest and dump the right waveforms. Due to the random behavior in ICE mode, each run may detect the same bug at different time stamps or, even worse, may not detect any bug (see figure). It’s random. Clearly, reproducing a bug in ICE mode, which is necessary to quickly converge to its root cause, can be a challenge.
Consider the case of an SoC populated with third-party IP. Time and again, an IP core that works in isolation doesn’t work when embedded in the SoC. Debugging such IP deeply embedded in the DUT via the ICE mode may cause countless sleepless nights to the verification team.
Deterministic ICE
The question then becomes: Is it possible to make an ICE environment debug deterministic? Gladly, the answer is positive.
If the designer captures stimulus and response in the first run in the exact sequence, then removes the physical target system (inherently non-deterministic) and replays the stimulus again and again, the debugging environment becomes repeatable and deterministic. Let’s call it Deterministic ICE.
Basically, this method converts a physical ICE environment into an equivalent virtual environment, giving designers the benefits of all the features and capabilities of a virtual environment. They can check assertion and coverage closure, perform low-power analysis and power estimation, and carry on embedded software debugging.
Conclusion
Setting my bias in favor of the virtual mode to the side, I must recognize that the ICE mode has good reasons to exist. Sometimes it’s the only possibility available to the user of hardware emulation when proprietary interfaces are required. Happily, the availability of Deterministic ICE will take designers away from the various issues that made the ICE mode so unattractive.


