What you'll learn:
- The ever-changing properties during cell charging.
- The impact of wire-path resistance.
- Dealing with charger inefficiencies.
When lithium-ion cell testers are being specified, the request is for a maximum voltage and maximum current per channel. The total available power per channel will be the product of the max voltage and max current, calculated as Max Power in Watts = (Max Voltage in Volts) × (Max Current in Amperes). The actual power consumed varies with time and it has losses that must be considered.
Voltage, Current, and Power Constantly Change as the Cell Charges
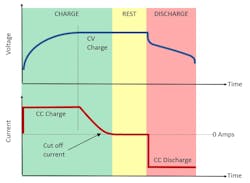
As shown in Figure 1, if the cell is being charged from low state of charge (SOC%), its starting voltage will be low (typically around 2.5 V) and the applied constant-current (CC) charge rate will be selected to achieve the appropriate charge profile.
With a low cell voltage, the power consumption will be low, even though the charge current may be set to a high maximum CC charge rate. Then, as the cell charges in CC, its voltage rises and thus the power delivered to the cell rises. As the cell nears its maximum voltage (typically around 4.2 V), the charge will still be in CC, and the power delivered will be at its maximum.
At this point in the charge process, the charging will switch from CC to constant voltage (CV) and the current will begin to drop. Even with the cell at its maximum voltage, the power delivered to the cell drops because the current drops. At the end of charging in CV mode, the voltage stays constant and the current reduces to near zero amperes, causing the power delivered to the cell to approach zero watts as the cell approaches 100% SOC.
To summarize the power profile:
- The power delivery starts at a low value.
- The power delivery rises to a maximum value when the cell is still in CC charge and the cell reaches its maximum voltage.
- The power delivery drops off to zero as the cell reaches 100 % SOC.
Let’s look at an example to determine the actual power profile.
In this example, we’re charging a cell with the characteristics shown in Table 1. The data in this charge is based on an actual charge profile. The shape of the voltage profile is similar to, but may not represent, the cell voltage that you have encountered in your cell testing.
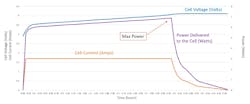
Figure 2 shows the voltage, current, and power profile of the cell as it is charged at 1.7 A. The power line clearly shows that the maximum power delivered to the cell rises as the cell voltage rises and achieves a peak of 6.9 W at the charge transition from CC charge to CV charge. Note that the average power during this 4.5-hour-long charge step is 4.8 W.
So far, we’ve only looked at the power delivered to the cell. However, there are other consumers of power during the charging process that need to be considered when determining how much power is needed to charge the cell.
Resistance in the Wiring and Contacting System
Proper wiring and contacting are critical to safe and successful charging. Using good engineering practices is important to avoid noise pickup, signal degradation, and, most importantly, to minimize troublesome voltage drops through resistances in the wiring and resistances in the contacting or probes.
If you’re testing cells at high currents, wire-path resistance will be a critical consideration. As test currents escalate, the resistance in the wires and the contacts/probes will cause significant voltage drops. To achieve proper voltage regulation at the cell, the charger electronics must overcome the variable voltage drops caused by variable current flow through all wire-path resistances during the charge process.
The charger electronics continuously measures the voltage at the cell via voltage-monitoring probes, sometimes called sense probes. This is also referred to as a 4-wire measurement. The charger’s feedback system takes the measured voltage and compares against the user-programmed CV voltage setpoint, which was 4.2 V in this example. The charger continuously makes adjustments to the charger’s output voltage to maintain the correct voltage at the cell as the current changes.
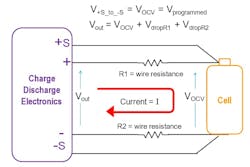
During charging, the output voltage of charger, measured at its terminals, will be higher than the cell voltage at the end of the wires. That’s because there’s a voltage drop in the wires between the output of the charger and the cell terminals (Fig. 3).
In Figure 3, voltage drops VdropR1 and VdropR2 are due to current flowing through wire resistances R1 and R2. These voltage drops complicate cell charging. During CV-mode charging, the charger electronics measure the cell’s voltage at sense terminals +S and −S, which have high input impedance. As a high-impedance input, no current flows into these terminals through the sensing wires and, therefore, the resistance of these wires is irrelevant—if no current is flowing in the sense lines, then there’s no voltage drop in the sense lines.
Using the voltage measured on the sense lines, the charger can detect the voltage drops in the current-carrying wires. Using the voltage measured at the cell, the charger electronics can regulate Vout to overcome the voltage drops in the wires. It does this by raising the charger output voltage to maintain the desired programmed cell voltage at the end of the current-carrying wires.
Likewise, the cell charger must know the current flowing to the cell during CC mode. The cell charger measures the current to the cell via an internal current measurement sensor. Current-monitoring pins aren’t needed because the current flow is the same everywhere in the current loop, which contrasts with CV mode where sense lines are needed to measure the voltage at the cell.
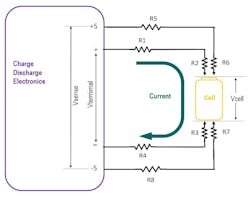
Whether the cell is charging in CC or CV, when current flows through the wire and contact/probe resistances, a voltage drop in the resistance of the wires and contacts/probes generates heat in the wires and thereby adds to the power requirements needed during charge (Fig. 4). Thus, keeping wires short and at low resistance will help reduce heating effect in the wires and reduce the total power required to charge the cells.
Table 2 shows all elements in the wire-path resistances.
Since current doesn’t flow through the sense wires, R5, R6, R7, and R8 don’t generate heat and don’t consume power. Therefore, for this discussion on power consumption and delivery, the sense lines can be ignored.
When it comes to power delivery, resistances R1 through R4 are critical. The charge current flows through R1 + R2 + R3 + R4, so we can treat them as a single lumped resistance Rwire when calculating the power loss in the wires. A reasonable value for Rwire is 200 mΩ for charger wiring designed for cell charging at 2 A. If the cell current was higher, such as 20 or 50 or 100 A, the wire would need to be thicker to reduce the R1 and R4. Also, the contacts/probes would need thicker pins or larger contact surfaces to reduce R2 and R3. At higher currents, Rwire would need to be just a few milliohms or even hundreds of microhms.
Now, let’s look at the current flowing and calculate the power loss through Rwire. The average charge current is 1.3 A and the peak charge current of 1.7 A. If Rwire is 200 mΩ, then the average power lost in the wires is 0.26 W and the peak power lost is 0.34 W. This represents an increase of about 20% of the power delivered to just the cell. While these values seem small, they must be supplied by the charger electronics, thus increasing the size and power of the charger by 20%.
Inefficiencies in the Charger Electronics
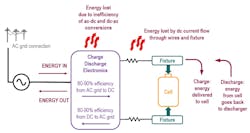
The charger electronics takes AC power from the AC line and converts it to DC power. The AC-DC power-conversion process has a conversion efficiency typically between 80% and 90%, with newer silicon-carbide-based systems achieving upwards of 96% efficiency. The total amount of DC power that the charger will need to deliver will be the sum of the power consumed by the charging cell and the power lost in the wiring.
When considering the power coming from the AC line, the AC-DC conversion efficiency must also be taken into account. Thus, the total power needed from the AC line will be the sum of the conversion efficiency + the power lost in the wires + the power delivered to the cell (Fig. 5).
Much More Power Needed Due to Losses and Inefficiencies
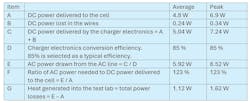
Let’s look again at the cell charging example from above along with wire losses and conversion efficiency (Table 3). All values are per cell.
As you can see, a significant amount of additional power is needed to charge the cell due to losses in the wires and inefficiencies in the charger’s power-conversion electronics. The additional power (in this case, 23%) must be considered when sizing the charger (F) to deliver the power to the cell and when sizing the AC line in (E) to power the charger. Lastly, the power losses (G) will be lost as heat into the test lab, placing an additional burden on the HVAC system.
One final note: These calculations were for a single small cell. As cell capacity expands, and the quantity of cells being simultaneously tested rises, these power requirements will grow to the kilowatt and megawatt range, for which a 23% increase in required power truly becomes a significant amount.
