When you design a data acquisition system, specifications are virtually the only way you can predict overall system performance. Specifications constitute a manufacturer’s promise of how well an instrument performs under a certain set of conditions and allow you to compare instruments from different vendors, provided the conditions are uniform for all products.
With data acquisition instruments so abundant today, it would be difficult to choose equipment even if all manufacturers used the same specification format and conditions. Unfortunately, they do not.
Each manufacturer tries to portray its products in the best possible light, and genuine differences of opinion exist concerning how to present specifications. The result? Similar instruments sometimes defy comparison. To help alleviate confusion, you need to know which specifications you should look for on a product sheet as well as how to interpret them.
Absolute and Relative Accuracy
Accuracy is a complex issue that can be subdivided into absolute accuracy and relative accuracy. Absolute accuracy is the closeness of agreement between a measured result and its true value, traceable to an accepted standard. It requires that an instrument be calibrated to a standard—typically a known National Institute of Standards and Technology (NIST) standard value or a calibrator traceable to NIST. Relative accuracy is the extent to which a measurement accurately reflects the relationship between an unknown and a locally established reference value.
Most data acquisition vendors will provide the specification components of absolute accuracy. These components are percent of reading (or ppm reading), offset value, noise + quantization, and drift.
Each component is key to determining how accurately the circuitry will make a measurement, including analog front-end signal conditioning and the analog-to-digital converter (ADC). No data acquisition instrument can make a perfect measurement. The instrument itself will contribute errors. However, under conditions set forth by the manufacturer, these errors should be within specified limits.
Data acquisition instrument-error specifications require two components:
-
Gain error, the portion of a measured value described as percent of reading.
-
Offset value, specified as a portion of full scale.
In abbreviated specifications, the gain error alone may be provided even though offset error is much more critical for measurements made at the low end of an input range.
Absolute accuracy can be an important consideration when choosing between 12-bit and 16-bit ADC instruments. Consider this example involving a 0.5-V signal measured on a 2-V bipolar range using a 12-bit ADC:
Assume absolute accuracy is specified as ±(0.005% reading + 1 LSB), where 1 least significant bit (LSB) is the offset value. If we are trying to measure 0.5 V, absolute accuracy is represented as: = ±(0.5 × 0.005% + 2*1/4,096)
= ±(0.5 × 0.00005 + 0.000488)
= ±(0.000025 + 0.000488)
= ±0.513 mV
In this case, 1 LSB offset error is 2/4,096 = 0.488 mV or 0.024% of range. The offset error is larger than the gain error by almost a factor of 20, making for poor measurement integrity at the low end of full scale.
With a 16-bit ADC, the same 2-V bipolar range, 0.5-V input, and specifications produce the following uncertainty: = ±(0.5 × 0.005% + 2*1/65,536)
= ±(0.5 × 0.00005 + 0.000031)
= ±(0.000025 + 0.000031)
= ±56 µV
In this case, 1 LSB offset error is 2/65,536 = 31 µV or 0.00153%. This offset error is similar to the gain error for midscale measurements.
While the gain accuracy may be similar for 12-bit and 16-bit boards, factors such as noise and linearity can be more significant, especially for low-voltage signals or where readings cannot be averaged to reduce noise.
Accuracy also can degrade over time. Specifications for high-quality data acquisition instruments frequently are given for one year, making annual recalibration necessary to maintain documented performance.
The second component of absolute accuracy is the noise + quantization error. System noise is the amount of additional noise added by the internal analog circuitry. Errors from noise can be reduced significantly by averaging the readings, but not every application permits averaging.
The peak-to-peak noise specification must be considered in calculating the uncertainty of a single-point measurement. The noise component of error often is specified as Vpk-pk or Vrms, but it is common to see this specification expressed as LSBrms. Better data acquisition instruments will include both a single-point and an rms or averaged noise + quantization error so you can compute absolute accuracy based on a single point or an averaged set of measurements.
Quantization Error
The difference between the unquantized input and the quantized output is called quantization error or noise. Quantization error is the result of the discrete steps that represent the analog input and is directly proportional to resolution. Quantization error defines a baseline noise level that effectively limits the ADC’s ability to resolve small signals in a perfect system. Higher-resolution systems have a lower baseline noise level, resulting in a greater dynamic range.
Drift
The last component of absolute accuracy is drift, which is inherent in all measurement instruments. Short- and long-term drift of gain and offset (zero) can be caused by the effect of ambient temperature, humidity, and pressure as well as the aging of components.
Intelligent instrument design predicts and compensates for the potential drift of circuit components. Data acquisition plug-in boards rarely address this issue and may be more vulnerable to drift. Some boards are designed with a programmable autozero that eliminates zero drift and helps guarantee accurate measurements.
Autozero is the process of applying an internal reference of 0 V and readjusting the digital-to-analog converter (DAC) trim until the measured value is as close as possible to 0 V. This process eliminates the effect of offset drift.
During application of the internal 0-V reference, the inputs are disconnected and remain unaffected by the adjustment process. However, the short is applied internally, so autozero will not correct external offsets due to connector thermal voltages and drift in signal-conditioning equipment.
At the factory, the calibration process is performed in a very stable environment, typically 23°C and 50% humidity. When products are used in the field, the original calibration environment rarely is repeatable.
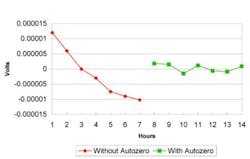
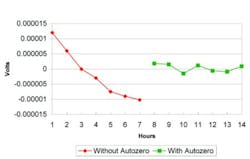
Autozero enables the hardware to perform accurately in its operating environment. Figure 1 shows a typical example for measurements taken at one-hour intervals of 0 V (an input short circuit). The measurement drift without autozero can be attributed to changes in ambient temperature.
Figure 1. Measurement of 0 V With Autozero Off and On
Absolute Accuracy = ±(0.5 V * 0.015% + 50 µV + 40 µV)
= ±(0.5 V * 0.000115 + 50 µV + 40 µV)
= ±(0.0000575 + 50 µV + 40 µV)
= ±147.5 µV
If the data acquisition instrument returns a measurement of 0.4998525 to 0.5001475 V, it is operating within specification.
DC and AC Accuracy
If an overall system-accuracy specification is not provided, there are other methods to convey accuracy. It is common to see separate DC and AC accuracy specifications. DC accuracy specifications should include integral nonlinearity (INL), differential nonlinearity (DNL), and system noise.
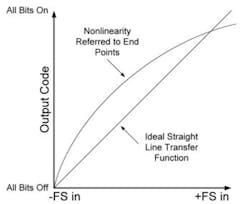
The INL specification expresses, in LSBs, the maximum deviation of the actual transition points in an ADC’s transfer function from the chosen straight line. This error also is called static linearity, absolute linearity, and, sometimes, relative accuracy.
A common method of graphing INL shows it referenced to end points (Figure 2). For end-point linearity, draw a straight line between the data acquisition’s offset and gain intercept points. Then the transfer function is plotted against the straight line. The maximum deviation from the straight line is the worst-case INL.
Figure 2. Integral Nonlinearity Referenced to FS End Points
INL can be determined by performing a voltage sweep from the (–) full-scale input to the (+) full-scale input and digitizing the voltage sweep. The worst-case INL can be found by subtracting the actual digital code obtained during the sweep from the straight-line value.
An Excel spreadsheet can be used to calculate the ADC deviation. Columns in Table 1 report the actual digitized code, the test voltages applied, and the ADC deviation of the digital values measured from the test values that make up the straight-line values. The ADC deviation is calculated using the equation:= [(Test Voltage *4,096 * + * 40,960)/20] – ADC Counts
The first part of the equation comes from solving for the digital code with a bipolar range of ±10 V when the test voltage is known. Figure 3 illustrates the deviation from zero, which is approximately 1 LSB.
Table 1. INL Excel Computation
| ADC Counts Measured |
Test Voltages Applied | ADC Deviation (LSB) |
| 1 | -9.992503 | 0.54 |
| 3 | -9.984497 | 0.18 |
| 4 | -9.976495 | 0.81 |
| 6 | -9.968499 | 0.45 |
| 7 | -9.960505 | 1.09 |
| 9 | -9.952469 | 0.73 |
| 11 | -9.944129 | 0.44 |
| 12 | -9.936127 | 1.08 |
| 14 | -9.928127 | 0.72 |
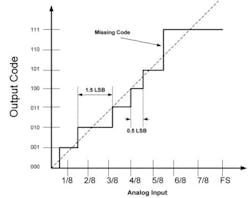
DNL, the second DC accuracy specification, is expressed in LSBs. DNL describes deviations from the ideal transition voltages in the ADC transfer function. For example, for a 12-bit ADC, the first transition will occur at 1/4,096 of full scale (0.000244 FSR), the second at 2/4,096 full scale (0.000488 FSR), and so forth. The deviation from that ideal transition is the DNL error for that code. The DNL specification should describe the worst-case transition of all the possible transitions of the data acquisition product.
A DNL specification of “No Missing Codes” refers to a digital code that the ADC or data acquisition instrument cannot produce, regardless of the voltage input. In some cases, no missing codes are specified at less than the resolution of the ADC being used on the board. Figure 4 illustrates DNL.
Figure 4. Differential Nonlinearity
System noise, the third DC accuracy specification, is expressed in LSBrms. System noise is attributed to analog circuits when the analog inputs are grounded. This error also may include quantization error unless otherwise specified.
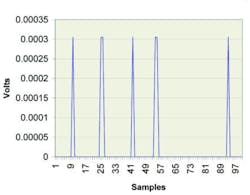
Figure 5 shows a plot of system noise for a 12-bit data acquisition board, using a 0 to 1.25-V unipolar input range where the inputs are grounded. The board has a system noise specification of 0.3 LSBrms.
Figure 5. System Noise
System Noise = 0.3 LSB * 1.25/4,096
= 91.6 µVrms
The measured value also can be considered as 0.000305 Vpk-pk. Statistical considerations show that peak-to-peak noise will be within five times the rms noise more than 99% of the time. As a result, the rms level commonly is multiplied by five to convert to peak-to-peak. Multiplying our system noise specification of 91.6 µVrms by five, the peak-to-peak noise becomes 0.0004577 Vpk-pk. The board meets specification.
Conclusion
All specifications should be published to form a complete picture of product performance, including pre-ADC signal-conditioning circuitry. Particular specifications may not be presented because certain levels of performance are not designed in or tested. When in doubt, contact the vendor for a clear explanation of the specifications to determine whether a product will meet your needs. Knowing all of the details will provide a greater measure of confidence in your equipment and data.
About the Author
Jonathan L. Tucker is the data acquisition product marketing manager at Keithley Instruments. From 1990 to 1999, he was the applications engineering manager at Keithley and previously held positions as a test engineer and applications engineer at the company. Mr. Tucker graduated from Cleveland State University with a B.S.E.E. and Kent State University with an M.B.A. Keithley Instruments, 28775 Aurora Rd., Cleveland, OH 44139, (440) 248-0400.
Published by EE-Evaluation Engineering
All contents © 2000 Nelson Publishing Inc.
No reprint, distribution, or reuse in any medium is permitted
without the express written consent of the publisher.
May 2000
