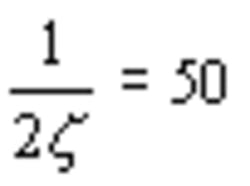
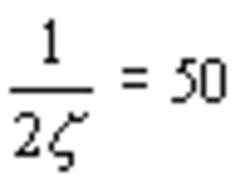
The shock response spectrum (SRS) is a fairly simple concept that has been in use for years.1,2,3 But occasionally it falls victim to an inappropriate test specification meant to exploit SRS features.
The SRS may be used for two diverse purposes:
- To predict the response of a structure under transient load.
- To measure the response of a structure under transient load.
Purpose #1 is the primary reason for SRS use. Purpose #2 represents a more complex and less understood issue. Both are processed in an identical manner, but there are subtle differences in interpretation.
One example of Purpose #2 is an attempt to make the SRS a Fourier-like narrow-band signal detector. The intent is to detect very low-amplitude, short-duration, single-frequency resonances while simultaneously characterizing the primary shock pulse; in other words, using the SRS for both purposes at the same time. In fact, there is only one case where the SRS can be compared to the Fourier: when undamped.
It was assumed that the SRS would operate in a pseudo-Fourier manner if two processing specifications were changed:
- Reduce damping to near 0, producing maximum sensitivity of the filter as shown in Figure 1.
- Set the single degree of freedom (SDOF) filter frequency progression to a small linear spacing over the frequency range to provide FFT-like resolution. However, analysis of the transmissibility vs. damping ratio (z) curves shows that the assumption is counterproductive.
Figure 1. Transmissibility Curve for Viscous Damped Mechanical SDOFs
Courtesy of Shock and Vibration Handbook, Fifth Edition, Harris and Piersol
The Specification
Let’s suppose a company issues a test specification requiring suppliers to perform shock tests on products as part of an ongoing quality monitoring program. The specification includes two conflicting requirements:
The intent of the two conflicting requirements appears to make potentially damaging shock-machine resonances more evident on the SRS plot. Although the SRS is an excellent peak amplitude detector, a problem affecting its application in this case arises from the linear 10-Hz filter line spacing when using z of 0.01.
This problem is filter response overlap, which occurs when the filter center frequencies (fr) are too close in relationship to their half-power bandwidths. The half-power bandwidth of an SDOF filter is approximately defined as B = 2zfr.
The Problem
The proper relationship between fr spacing and z occurs at the crossover half-power amplitude points as shown in Figure 2.4 This only can be achieved using log frequency with relatively few filters such as six or 12 filters per octave. This becomes obvious when analyzing the various values of B that exist under the specification.
For the first SDOF at 10 Hz, B is 0.2 Hz. At the other extreme at 10 kHz, B is 200 Hz. At the midrange frequency of 5 kHz, B is 100 Hz. The low-frequency condition is illustrated in Figure 3.
For the first line at 10 Hz, B would extend from 9.9 Hz to 10.1 Hz. No overlap exists here since the filter situated at the next interval, 20 Hz, will have a B extending from 19.8 Hz to 20.2 Hz.
In fact, the filters are too far apart. This creates another problem—lack of any response contribution between the filter skirts resulting in the SRS plot having amplitude errors within these gaps. It is not until we reach an SDOF frequency of 500 Hz that the skirts crossover at their half-power amplitudes, as shown in Figure 2.
Since B is proportional to fr, as frequency increases above 500 Hz, the degree of overlap increases. The overlap will reach a maximum at the highest frequency of the plot; in this case, 10 kHz. At this frequency, the half-power bandwidth will be 200 Hz. This will envelop 20 adjacent SDOF filters spaced at linear 10-Hz intervals.
This condition is shown in Figure 4. This high degree of overlap will contribute a response across these adjacent SDOF filters even if the signal is centered at an exact fr.
Figure 4. Example of SDOF Filter Spacing Problem at the 10-kHz End of the 10-kHz Linear Spectrum
Considering the most critical response frequency of a product such as a hard disk drive with stack/actuator resonances near 500 Hz, the specification with z = 0.01 would result in a B of 10 Hz at this fr. Only at this fr would the overlap provide normal SRS frequency resolution.
However, any narrow-band response signal contribution still would be smeared over at least two SDOF filters due to their broad shape, resulting in a loss of frequency resolution. This would be more pronounced at higher fr. The sharp Fourier-like spike expected would be a low-amplitude hump.
If you compare the elegant, narrow-band filter shape of the FFT to the lousy filter shape of the SRS, a decision to use the FFT process would be made for this detection requirement.5 A specification intended to provide high-resolution detection from the SRS is inappropriate due to adjacent SDOF filter contributions.
Common Practice
SRS plots usually are specified as log-log amplitude vs. frequency. Other than achieving a broad dynamic range, there are various reasons for this, including the capability to judge the validity of the specified shock test by evaluating the up-ramps of the residual spectrum.
Most importantly, when SDOF fr spacing is set in terms of lines per octave, there is proportionate spacing of the filters over the entire plot, resulting in a more uniform response with frequency. This is the most accurate condition.
Using the industry-standard 1/6th octave log resolution, overlap crossovers are at the half-power points of adjacent oscillators at 5% damping. Lower damping ratios may warrant a finer resolution, but crossover at other than half-power points is not recommended.6
Damping usually is specified at 5% of critical. This value is recommended in all test specifications that require SRS and has been found to be a realistic value for representative real-world systems when predicting response. Finally, the use of very narrow fr spacing, less than the presently accepted 1/6th or 1/12th lines/octave for log plot standards, does not contribute to the analysis and can lead to misleading results.
Recommendations
Abandon the use of the SRS for the purpose of detecting narrow-band resonances. This is more successfully accomplished using Fourier spectrum methods. If you decide to use the SRS for its primary strength to determine if the shock pulse is correct, then solve the half-power bandwidth problems by using a normal log frequency plot at 1/6th or 1/12th octave SDOF filter progression and 5% of critical damping.7
The SRS is not a frequency-domain tool although it confuses some because it appears in an amplitude vs. frequency format.
Conclusions
Because of SDOF filter bandwidth overlap, the capability of the SRS to perform pseudo-Fourier analysis is lost when fr progression is linear. At analysis frequencies greater than 500 Hz, narrow-band energy detected in the time domain will be smeared across several fr, and the resolving power will be sacrificed. It would be better to use the FFT.
The lack of proper overlap at frequencies below 500 Hz will cause the loss of amplitude accuracy, which increases with decreasing frequency. Additionally, narrow-band resonance signals whose fr is located midway between the 10-Hz-spaced filter frequencies will not be detected at all, even if they are high in amplitude.
Proper attention must be paid to the specifications for SRS processing to prevent inaccurate results. The user industry has developed commonly accepted specifications for SRS over the years.8 These specifications are the result of academic analysis as well as practical experience and not intended to dissuade the reader from using SRS. SRS is the primary tool for accessing transient loads, an application that is not the province of the FFT. Properly done, the SRS is a powerful tool.
References
- Biot, M.A., “Theory of Elastic System Vibration Under Transient Excitation With an Application to Earthquake Resistant Buildings,” Journal of Applied Sciences, Vol. 19, 1933, pp. 260-268.
- Matsuzaki, Y. and Kibe, S., “Shock and Seismic Response Spectra in Design Problems,” Shock and Vibration Digest, 15(10), Shock and Vibration Information Center, Naval Research Laboratory, 1983.
- Smallwood, D.O., “An Improved Recursive Formula for Calculating Shock Response Spectra,” The Shock and Vibration Bulletin, No. 51, part 2, May 1981, pp. 211-217.
- Himelblau, et al, “Handbook for Dynamic Data Acquisition and Analysis,” IEST-RP-DTE012.1, Institute of Environmental Sciences and Technology, Rolling Hills, IL, 1994.
- Piersol, A.G., Private Communication, December 2002.
- Himelblau, et al.
- Henderson, G.R., “A Proposed Method of Standardizing Shock Machines Using SRS,” Journal of the Institute of Environmental Sciences, July/August, 1994, pp. 40-46.
- Himelblau, et al.
About the Author
George Henderson founded GHI Systems in 1978. He holds a B.S.E.E. from Utah State University and has an extensive background in electronic, optical, and mechanical systems testing. GHI Systems, 916 N. Western Ave., San Pedro, CA 90732, 800-444-7978, e-mail: [email protected]
Return to EE Home Page
Published by EE-Evaluation Engineering
All contents © 2003 Nelson Publishing Inc.
No reprint, distribution, or reuse in any medium is permitted
without the express written consent of the publisher.
June 2003

