Serial communications are easy. Determining exactly what was transmitted is more difficult.
Analog or digital, all oscilloscopes display changing signal characteristics as a function of time. Physical-layer signal measurement remains at the heart of the most modern of today�s scopes.
Certainly, there have been changes to scopes, but these generally fall into the faster, wider, deeper categories. An example is the high-speed performance developed to accommodate gigahertz communications applications. However, some scopes do offer specialized capabilities such as serial data triggering, an important feature for working with serial data streams.
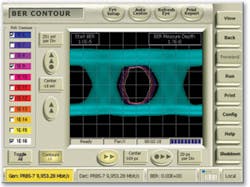
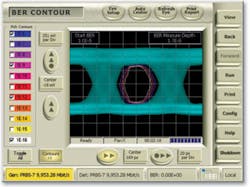
35% UI Sinusoidal JitterA measured BER contour is shown for 1E-6 and projected contours for 1E-9, 1E-12, and 1E-16.Courtesy of SyntheSys Research
To accommodate the large demand for even more functionality targeted at high-speed serial communications applications, a separate class of scope-like instruments has been developed. These products can operate as conventional scopes and also may provide a time-domain reflectometry (TDR) function, but their main distinguishing feature is a range of built-in clock and data-recovery (CDR) capabilities.
Each major manufacturer has coined a distinctive product name. Generically, these instruments are serial data analyzers (SDAs), and this is the name LeCroy has used to describe the SDA 6000, a four-channel instrument with a 20-GS/s maximum sampling rate on each channel and up to 100-MS of memory.
Tektronix has adopted the communications signal analyzer (CSA) term, and Agilent Technologies� instruments are called digital communications analyzers (DCAs). Unfortunately, although you can be sure that any of these products will deal with a wide range of serial data applications, you can�t tell from the names whether a particular model uses direct or equivalent time sampling (ETS).
The distinction is important because of the measurement technique required by certain serial communications link specifications. The measurements split into two basic groups: those that require knowledge about a signal�s future behavior, such as PCI Express, and those that don�t. Only a direct sampling analyzer develops a contiguous time record of the waveform, so until recently, this type of instrument had to be used to measure PCI Express signals.
In contrast to other standards that measure data relative to the recovered clock directly associated with the data, PCI Express has required the use of a clock derived from 1,500 unit intervals (UIs) ahead of and 1,500 UIs after the 250 UIs you wish to characterize. Only a direct sampling SDA has been suitable.
On the other hand, in the recent 1.1 revision to the PCI Express standard, provision was made to characterize data based on a clock recovered using a first-order phase-locked loop (PLL) with certain parameters, which allows an ETS-based instrument to be used. The results of the two techniques are very similar but different.
Clock and Data Recovery
Each serial data specification, optical or electrical, provides a unique set of parameters that describe the clock recovery procedure. In general, the received signal is filtered and then tracked by a PLL. The PLL characteristics determine how much jitter can be rejected and by how much time the recovered clock is displaced from its ideal position.
The goal is to present an eye diagram of the recovered data as the actual data receiver would produce it. With this information, a user can relate eye closure to bit error rate (BER), for example. Looking at the raw signal ahead of the receiver has little meaning because real receivers are capable of removing a large amount of jitter. What seems completely unintelligible may become a very low error rate signal after the receiver.
Once the raw data has been recorded, a software PLL can be used to recover the clock. John Calvin, a senior software engineer for the performance scope line at Tektronix, described the process: �Typically, we acquire eight or more real samples per UI. This means that we�re oversampling compared to Nyquist and can reconstitute the waveform with pretty good fidelity. Then we run the signal through a numerically precise PLL.
�The power of software allows you to look at the signal as though it had been recovered by a first-order PLL. If that�s not right, you can try a second order. In fact, if you�re working with PCI Express signals where the spec calls out a constant-rate clock recovery based on a median period,� he explained, �you can apply a numerical technique that directly mimics the spec.�
The RT-Eye� Serial Data Compliance and Analysis Software enables a Tek TDS/CSA7000B or TDS6000B scope to perform post-acquisition clock recovery strictly in accordance with the appropriate standard. A large amount of parameter programmability is provided to support investigation during development or troubleshooting.
At the other extreme of customization are the optional standard-specific
RT-Eye Compliance and Analysis Modules. These modules provide pass/fail waveform mask and measurement limit testing in accordance with the relevant standard and are particularly useful during plug fest evaluations. Critical parameters are not adjustable.
In contrast to the RT-Eye application, the Tektronix CSA7404B includes a hardware clock recovery circuit. Based on a PLL, its bandwidth is programmable to be typically the bit rate/1,600. So, for Infiniband, which runs at a 2,127-Mb/s data rate, the bandwidth of the clock recovery PLL would be 1.33 MHz. According to the Tektronix data sheet, this level of PLL performance results in a recovered clock jitter <0.2% bit period + 5 ps for pseudorandom binary sequence (PRBS) or + 4 ps for a repeating 011011 data pattern. For Infiniband, the typical clock jitter is 5.94 ps or 4.94 ps, respectively.
One of the main advantages of an ETS SDA is its high bandwidth, >80 GHz in the case of the Agilent Technologies Model 86100C Infiniium DCA with advanced jitter analysis (DCA-J). With the appropriate clock recovery plug-in module, you can address electrical, optical single-mode, and optical multimode transmission media.
For example, the Agilent Model 83495A Module provides continuous rate coverage in the 10-Gb/s band including 9.95 Gb/s SONET/SDH, 10 GbE at 10.3125 Gb/s, and 10X Fiber Channel at 10.51875 Gb/s. In addition, a built-in clock recovery circuit meets the typically specified 4-MHz PLL bandwidth.
Once the clock has been recovered, display modes such as the 86100C�s Eyeline become possible. Instead of viewing many overlaid bit sequences, Eyeline displays only those sequences that are causing mask violations. Operation is simplified by the instrument�s capability to extract the underlying pattern in most cases without a trigger.
�The importance of new test capabilities is easy to understand when you consider that ISI problems typically manifest themselves in the final stages of a project. They generate the most anxiety,� he continued, �and are the most costly to fix, often requiring the respin of a board layout or IC mask. Naturally, these kinds of difficult problems can lead to delays and even cancellations.�
One of the unique features of LeCroy�s SDA Series is the ISI plot capability. Dr. Michael Lauterbach, the company�s director of product management, said, �This display directly shows the amount of jitter and signal distortion due to ISI and is used for both fault location and analysis. With a repeating data stream, jitter caused by ISI also will be repetitive, and the SDA�s random interleaved sampling (RIS) mode can be used to achieve accurate determination of edge position.
�On several occasions, customers have sent similar eye-diagram pictures to me, asking if I could help identify the fault causing their systems to malfunction. The nature of the fault,� he explained, �was that roughly half of the bits in the eye were distorted: the signal bulged downward from the top or upward from the bottom. Using the ISI plot feature, we identified certain bit patterns that were causing the anomalous bulge.�
A New Technique
SDAs are application-specific instruments that mimic the operation of real clock recovery circuits. In this way, displayed eye diagrams represent what is occurring at the output of the actual receiver as closely as possible. From the recovered data and clock signals, measurements of jitter and BER can be derived.
Taking a different approach to serial data analysis, SyntheSys Research has developed the BERTScope�, which features a unique sampling concept. Charlie Schaffer, the company�s vice president of marketing, described the technique: �The data acquisition system is based on a dual sampler technology creating a sampling window that can be shifted in time and voltage thresholds to scan an eye diagram (Figure 1). The sampling window acquires samples for the eye diagram at the data rate.
�This means that eye diagrams can get much deeper data on random jitter and noise and on rare events such as pattern-dependent effects in long PRBS 231-1 patterns,� he continued. �Eye-diagram sample acquisition is several hundred times faster than for conventional scopes and SDAs.�
Because the BERTScope also includes an internal pattern generator, an optional stressed-eye capability is available. In stressed-eye testing, an eye diagram with a large amount of eye closure is used for testing receiver sensitivity. Calibrated levels and frequencies of intersymbol and sinusoidal interference and sinusoidal, random, and bounded uncorrelated jitter can be generated to simplify stressed-eye testing.
Conclusion
Clearly, there are many approaches available for capturing and analyzing high-speed serial data. Because details of the required measurements vary greatly from one type of link to another, the first step in determining the most appropriate test instrument is to thoroughly understand the specification for your serial data system.
Clock recovery, jitter, and BER are complex subjects. To become confident that you are measuring the intended effect in the prescribed manner, you will need some background reading, hands-on experience, and perhaps discussion with experts. Although today�s SDAs thoroughly address most areas of serial link characterization, you will have little option but to blindly accept the instrument�s measurement values unless you know what the link standard actually specifies.
Three Kinds of Sampling Explained
To achieve the highest possible sampling rate, the digitizers associated with individual channels often can be operated in parallel and their output data words interleaved. For example, the four-channel Tektronix CSA7404B provides a sampling rate of 5 GS/s on each channel, 10 GS/s if only two channels are used, or 20 GS/s on a single channel.
Because of noise generated in the SDA trigger circuitry and noise on the input signal, triggering will occur at a slightly different position on each cycle of a repeating waveform. This phenomenon is quantified as trigger jitter and not related to the sampling clock rate. However, even if the trigger event were to occur precisely at the same point on a repeating waveform, successive acquisitions of the signal would vary by up to one sampling clock period because the internal time base and the external trigger event are unrelated.
Relative to the acquired data, the trigger appears to have up to a one-sample-period jitter. Some SDAs measure the time from the trigger to the beginning of acquisition and interpolate between the captured data points to remove this source of jitter.
Recovering the embedded clock from a long, contiguous record is one way of completely removing both actual trigger jitter and the offset between the trigger and the internal sampling clock. In contrast, the trigger jitter inherent in an ETS-based SDA, although small, affects each group of acquired samples differently and cannot be removed as easily.
Traditional Sampling Scope
The traditional sampling scope only acquires one point per trigger event and only works with repetitive waveforms. The trigger signal starts an analog ramp generator that provides one input to a comparator that controls sampling. The other input is a reference voltage. After each trigger, the reference voltage is increased slightly, resulting in successive samples being acquired after a longer and longer delay.
Sampling scopes operate by creating an alias of the input waveform. But because the sample point delay increases linearly, the alias accurately represents the original signal.
Equivalent Time Sampling
This technique, also called RIS, requires that the external trigger and signal are unrelated to the instrument�s internal time base. As with the sampling scope, only repetitive waveforms can be used.
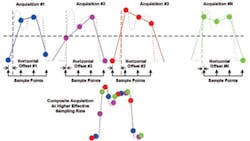
The analog trigger occurs at nearly the same position on each repeated waveform, but because of the asynchronous trigger-to-time base relationship, each acquisition�s internal instrument clock is delayed by a random amount of time from zero to the length of the clock period. After an acquisition, this time is measured and used to qualify the captured data.
Figure 2 shows that, depending on the time-base rate chosen, a fraction of the memory depth can be filled from a single acquisition. For example, if the ADC is run at its maximum rate and the chosen time base is 10� faster than the highest direct sampling rate, then points will fill only 1/10 of the total memory, and they will fall 10 equivalent sample intervals apart. In other words, they will form a comb of samples offset by some measured delay from the trigger.
Many DSOs force the phase of the internal clock to change before the acquisition of a comb of samples. Although it is unlikely that an external signal would be nearly identical in frequency and phase to the internal sampling clock, randomly upsetting the sampling clock phase before acquiring each comb ensures that ETS will operate correctly under all conditions.
The result of this random sampling process is improved operating speed. Only a fraction of the triggers required by a traditional sampling scope typically is needed to create an equivalent time-sampled display.
FOR MORE INFORMATION
on the Tektronix CSA7404B
www.rsleads.com/501ee-220
on the Agilent Technologies 86100C Infiniium DCA
www.rsleads.com/501ee-221
on the LeCroy SDA6000
www.rsleads.com/501ee-222
on the SyntheSys Research BERTScope
www.rsleads.com/501ee223
January 2005


