Extending the Frequency Range of RF/Microwave Measurements
Simple converters are the most economical and effective method of increasing the frequency performance in PXI-based RF analysis systems.
Virtual instruments, also known as syntheticinstruments, have become quite a talking point over the last few years. The U.S. military has seen the advantages of modular, lightweight, reconfigurable systems and awarded a number of contracts based on that concept.
By taking a modular approach, the cost to upgrade or reconfigure a system is greatly reduced when compared to conventional rack-and-stack products. VXI and PXI are just two of the standards currently being used to provide flexible test systems although there appears to be more of a move toward PXI with its smaller size and weight, faster bus, and wide variety of available modules.
However, conventional wisdom said that RF and microwave instrumentation products could not be reproduced in PXI. Digital signals were fine, and low power was no problem. Even instruments like a digital oscilloscope or an arbitrary waveform generator could be made in a PXI format�but not RF and microwave test equipment.
There still remained a need for a small, economical, reconfigurable RF and microwave measurement and generation system that could perform many of the tasks previously assigned to separate instruments. All that was required was a different approach.
For example, instead of trying to pack a conventional spectrum analyzer into a PXI module�a task similar to putting several quarts into a pint pot�the technique Ascor used downconverts the RF signal to a lower frequency, usually around 20 to 30 MHz, that can be handled by a digitizer. Once the signal is in a digital form, it then becomes relatively easy to extract the information from the data, such as frequency, power, modulation, and harmonic content.
The same approach only reversed provided the signal-generation capability of the system. A low-frequency signal is fed into an upconverter with the final output frequency in the band of interest. Modulation can be provided through an arbitrary waveform generator or even created in software.
Current Systems
Today�s PXI RF analysis systems have a high-frequency limit of 2.7 or 3 GHz and with the appropriate software provide the following measurement capabilities:
-
Spectrum analysis
-
Power measurement (peak and average)
-
Adjacent channel power measurement
-
Modulation analysis
-
Occupied bandwidth
-
Frequency response
A typical cost for such a system with these measurement capabilities is around $15,000. A spectrum analyzer alone is this much if not more.
While the PXI RF analyzer system may not have all the performance specifications of equivalent stand-alone products, it provides more than sufficient performance at a lower price to do the job for which it is intended. In most cases, the RF analyzer would be used in a manufacturing environment where speed of operation and ease of use are more important than state-of-the-art performance. Furthermore, it is packaged with software that can be customized for a precise test application.
Currently, to perform 802.11a testing in PXI, it is necessary to downconvert a band of frequencies around 5.6 GHz to a range of 1.1 to 2.2 GHz. A number of different ways were examined to convert the 5.6-GHz signal to a frequency within the desired range.
Conversion Techniques
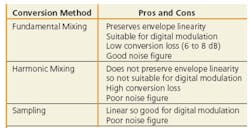
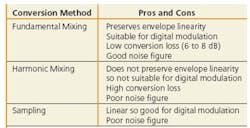
Table 1 shows the three main techniques considered for downconversion. Fundamental mixing appeared to be the best approach. In the case of the 4.9- to 6-GHz downconverter, a fixed local oscillator was used, and the 1.1-GHz output frequency range is the same as the input frequency range. This is known as block conversion.
Using this approach, a two-slot-wide PXI downconverter module converts signals in the 4.9- to 6-GHz band into the range 1.1- to 2.2-GHz. A block schematic of the module is shown in Figure 1. The downconverter has a fixed local oscillator locked to the 10-MHz reference of the RF analyzer. The input signal is mixed with the local oscillator and then filtered to provide the lower frequency output.
Any time you mix two signals you get a lot more than just the frequency you want. As a result, the design of the downconverter has to make sure that these unwanted signals are filtered out. These filters also reduce the level of the local oscillator frequency at the input and output of the converter. Small 2-dB attenuators also can be added to the three ports of the mixer to improve the match and the overall flatness of the system.
A mixer will produce lower and upper sidebands. In this case, the lower sideband is selected as it covers the 1.1- to 2.2-GHz band. The upper sideband is filtered out by the low-pass filter on the output side of the mixer.
However, a small complication called spectral inversion happens when you choose the lower sideband. For example, if the local oscillator frequency (FLO) is 7.1 GHz and the input frequency (FIN) is 4.9 GHz, then the output frequency (FOUT) is 2.2 GHz or 12 GHz.
The 12-GHz signal is reduced >60 dB by the low-pass filter and has little to no effect on the output of the converter.
It follows, then, that an input frequency of 6 GHz will give output frequencies of 1.1 GHz and 13.1 GHz. So if you swept the input and looked at the detected output, the low end of the band would be on the right side of the display and the high frequency on the left side, which is exactly opposite to the way we are accustomed to looking at swept frequencies. Fortunately, the spectral inversion can be easily corrected in software and the display returned to normal.
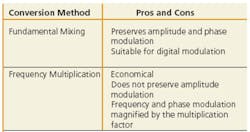
To address the signal-generation needs, an upconverter converts signals from 1.1- to 2.2-GHz to the 4.9- to 6-GHz band. Two techniques looked at for upconversion are listed in Table 2. Again, fundamental mixing was chosen.
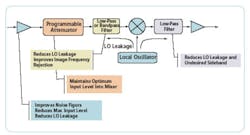
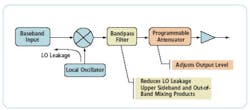
The block schematic of the upconverter basically is the same as the downconverter only switched around to accommodate a frequency input lower than the output frequency (Figure 2). Once again, 2-dB attenuators can be used to improve the match at each port of the mixer, and the same fixed local oscillator and switches are used to provide conversion or straight-through performance.
Again, correction has to be made for spectral inversion. The upper sidebands are removed by a bandpass filter in the output stage with the final output level being controlled by a programmable attenuator.
To perform 802.11a testing, the cost of the RF analysis system increases to between $5,000 and $9,000. A new signal generator or spectrum analyzer to cover the extended range is at least five times more expensive.
Future Requirements
The world of telecommunications rarely stands still, and new applications are emerging all the time. One of the newest is WiMax or 802.16a. This format is designed so that anyone can connect to the Internet from just about anywhere. No searching for hot spots�just fire up your WiMax modem and get on the air. The concept is similar to the cellular telephone network with accessibility for all who buy the hardware and sign up for the service.
The carrier frequencies proposed for WiMax extend all the way to 66 GHz, but the frequency band most commonly discussed at the moment is 3.2 to 3.7 GHz.
With a reasonably narrow bandwidth of 500 MHz, this can be done with a simple block downconverter similar to the one shown in Figure 1. The local oscillator frequency and the various filters probably would need to be changed, but the overall look and performance would be the same. This approach also would apply to an upconverter.
Wider Band Applications
Some applications need more than a 500-MHz bandwidth. In these cases, a tunable local oscillator must be used to control spurious and image frequencies. Designs have been created to cover 2.7 to 6 GHz using a YIG-tuned synthesizer locked to the 10-MHz reference.
The output frequency range of the converter with a tuned local oscillator will not be as wide as the input frequency range. The band would have to be analyzed in segments. This does not appear to be a problem because the bandwidths of interest are in the 20- to 30-MHz range, well within the capabilities of the current frequency-extender designs.
Even with the greater degree of complexity involved with tunable local oscillators, the frequency converter approach still offers the most economical and convenient method of extending the range of current RF analyzer systems.
Is 6 GHz the Limit?
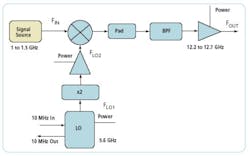
Not at all. There are limitations on what can be done in PXI simply because of its small size. However, there is a design on the books for an upconverter with an output frequency range of 12.2 to 12.7 GHz (Figure 3).
Summary
Simple converters are the most economical and effective method of increasing the frequency performance in PXI-based RF analysis systems. They require little to no change in the system software, operate in a transparent mode, and provide full flexibility. As requirements change, only the converter needs to be changed, not the whole system, which could be the case with rack-and-stack instrumentation.
About the Author
Bill Nicklin has been involved in test and measurement since the early 1970s and currently is the vice president of sales and marketing at Ascor. He received a B.S.E.E. from Lanchester Polytechnic, Coventry, England, and has lived in the United States for the past 27 years. Ascor, 4384 Enterprise Place, Fremont, CA 94538, 510-490-2300, e-mail: [email protected]
FOR MORE INFORMATION
on the Ascor Model 7205 Downconverter
www.rsleads.com/504ee-184
April 2005
