When looking at protocol information on a bus, an oscilloscope may not be the first instrument to come to mind�until now.
As most engineers know, digital oscilloscopes are an indispensable instrument for viewing and analyzing electrical signals�the hammer, if you will, in an electrical engineer�s toolbox. But it may not be well known that oscilloscopes, in addition to being ideal instruments for physical-layer waveform analysis, also can be used for protocol analysis of common serial data buses such as Inter-Integrated Circuit (I2C), Serial Peripheral Interface (SPI), and Controller Area Network (CAN).
Serial Data Bus Problems
Serial data bus problems come in many forms. However, most bus problems are classified as noise, signal quality, timing, or data errors. Signal noise on a data bus can lead to a number of problems and typically is more problematic on high-speed buses and densely populated circuit boards as signal voltage levels decrease.
Since these are all trends occurring in today�s electronics, noise is a common problem in bus designs. Common noise sources include crosstalk from other signals, EMI, and switching noise from a power supply.
Signal quality is a general term referring to the overall behavior of a signal relative to ideal conditions. Waveform quality problems come in many forms, but some of the most common are signal levels that are too high or too low, overshoot and undershoot, and rise/fall times that are too slow or too fast.
An example of a waveform quality problem is a data signal that has a rise time that is too slow. At the time of the clock pulse, when the data is to be read, if the data signal has not yet risen to a sufficient voltage level, the data is read incorrectly as a 0 instead of a 1.
Signal timing on a bus is another common source of errors and frustration. In the most basic sense, timing problems refer to events on one or more waveforms not occurring at the desired time. For example, a bus specification may refer to data packets occurring no more frequently than every 400 �s. If two data packets occur less than 400 �s apart, the processor may not have sufficient time to process the data. Other timing errors include setup-and-hold violations.
Data errors simply refer to incorrect data flowing on the bus and can be a result of a software problem, a damaged IC, or any number of other hardware problems. Even if all other errors are under control but data errors exist, then there will be problems.
A Variety of Instruments for Bus Analysis
In general, different types of test equipment are better suited for detecting and analyzing the different errors. Depending on what needs to be looked at, what types of equipment are available, and your level of comfort with the different types of equipment, some combination of oscilloscopes, logic analyzers, or protocol analyzers likely will be used to troubleshoot these bus problems.
While logic analyzers, dedicated bus-specific protocol analyzers, and digital oscilloscopes offer varying degrees of insight, no single piece of test equipment is perfect for identifying or analyzing all these different problems. A logic analyzer, while ideal for identifying complex timing issues, doesn�t offer much help in the way of seeing noise or waveform quality problems. Similarly, a dedicated protocol analyzer is perfect for identifying exactly what information is flowing on the bus and when it occurs, but it typically will not help identify a noise or waveform quality issue.
A basic digital oscilloscope, on the other hand, certainly is more versatile than a logic analyzer or protocol analyzer. While scopes are excellent tools for identifying noise, waveform quality problems, and even many timing problems, traditional scopes don�t provide insight into bus protocol. By adding serial data bus triggering and protocol analysis, some of today�s new oscilloscopes take a big step toward being the right tool for serial bus analysis.
Key Oscilloscope Specifications
Before going into more detail about the serial bus-specific triggering and analysis features found on some of today�s scopes, let�s review the basic scope requirements for accurately capturing serial data bus signals. The three main considerations when selecting the right scope for the job are bandwidth, sampling rate, and memory.
The analog bandwidth of an oscilloscope is almost universally defined as the frequency where the manufacturer guarantees that a signal component of that frequency will not be attenuated by more than 3 dB. Ideally, the frequency response of the scope will be nearly flat and minimally attenuate signals less than the bandwidth of the scope. Typically, the frequency response rolls off quickly above the specified bandwidth and highly attenuates higher frequency signal content.
The obvious question regarding bandwidth is �How much is enough?�. There is no exact answer, and engineering judgment must be used. The common rule of thumb says that a scope with a bandwidth three to five times the highest frequency component of the signal of interest will suffice, which means the amplitude error will be less than ~5%.
However, the frequency component of interest usually is not the fundamental frequency of the signal. Let�s say your serial bus has a data transfer rate of 1 Mb/s. Assuming a continuous series of 0101�, the fundamental frequency of the signal is 500 kHz. But remember, this is a square wave with frequency content extending out indefinitely in the frequency domain.
The result of the scope�s limited bandwidth attenuating the higher frequency harmonics of the input signal is a rounding off of the true square wave. The waveform displayed by the scope appears to have slower rising and falling edges than those of the actual input signal.
Here is where the engineering judgment comes in. Finding a scope with sufficient bandwidth typically is not a problem for buses with slower data rates. However, for buses with data rates of hundreds of megabits per second and higher, it can be difficult and expensive to find a scope with enough bandwidth.
Also keep in mind that an oscilloscope�s bandwidth limits the amount of noise displayed on a signal. For example, let�s look again at the 1-Mb/s signal and assume that the signal has some noise. A scope with a bandwidth of 100 MHz usually will display less noise than a 1-GHz scope.
While it may be advantageous at times during the design stage to use a lower bandwidth scope to reduce the amount of displayed higher frequency noise and isolate the lower frequency main waveform, don�t fool yourself into believing the noise really isn�t there. If you test your product on a 100-MHz scope and ship it to your customer who looks at it using a 1-GHz scope, there may be significant amounts of unacceptable noise.
An oscilloscope�s sampling rate also affects how accurately an input waveform is captured. The sampling rate refers to how fast the analog-to-digital converter (ADC) samples the incoming signal. It is important to note that a scope�s maximum sampling rate does not tell the entire story. Since a scope�s sampling rate is related to its memory length (available memory = sampling rate � the recording time), memory length also must be taken into consideration when selecting a scope.
Let�s compare two scopes. Scope #1 has a maximum sampling rate of 5 GS/s and 10 kpoints of memory per channel. Scope #2 has a maximum sampling rate of 200 MS/s but 1 Mpoint of memory per channel. Let�s say you want to record 100 ms of bus data. Scope #1 only samples at 100 kS/s because of its limited memory. Scope #2, even though it has a lower maximum sampling rate, can sample at 10 MS/s or 100 times faster than Scope #1.
So what is a sufficient sampling rate? Similar to bandwidth, there is no exact answer but rather a rule of thumb. For the best results with binary signals, try to sample at least 10 times faster than the highest frequency signal component you are interested in.
When considering the necessary sampling rate for square waves, the 9th harmonic of the fundamental frequency usually can be used as the highest frequency component of interest. If the signal you are capturing does not have fast transitions, you probably can sample at a lower rate and still get a good representation of the signal. Three to five times the fundamental frequency of the signal should suffice in this case.
Basic Scope Features for Bus Analysis
In addition to sufficient scope bandwidth, sampling rate, and memory, all of which are necessary for accurate waveform capture, many scopes offer a number of basic features that can be used to analyze and troubleshoot serial data buses. One of these common features is the capability of the scope to calculate a number of waveform parameters. For example, the scope could calculate and display the rise or fall times of a waveform, overshoot and undershoot, the max and min values, or the rms value of the waveform.
Other common scope functions useful for bus analysis are zoom windows. Most scopes today have at least one zoom window; some scopes have more.
When a scope captures a long string of serial data, zoom windows are useful for looking at and studying subsets of the total data in greater detail. For example, a scope with two zoom windows could simultaneously view two different data packets or maybe isolate both a rising and a falling edge of a problem signal.
Cursors also are useful tools when investigating waveform behavior. Vertical cursors can look at timing relationships between events on a single waveform or between events on multiple waveforms. Horizontal cursors are helpful when looking at max and min values, overshoot, and other voltage-level-related items.
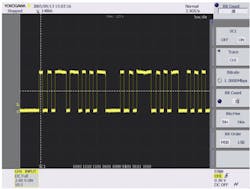
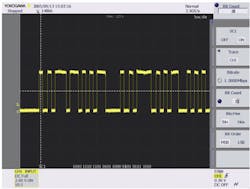
Some scopes also include general-purpose serial bus cursors, which save you from the cumbersome task of counting lots of 1s and 0s. By simply selecting the bit rate of the data, the voltage threshold level, and the start position, the serial cursor function displays the binary data in hex or binary format (Figure 1).
Similar to the serial cursor function, some scopes include a general-purpose serial pattern search function. It allows you to select as many as four different serial bit patterns to search for, providing the capability to quickly locate patterns of interest in long strings of data.
Last but not least is triggering. Some of today�s high-end scopes offer serial data pattern triggers. Serial data triggers allow you to define a pattern in hex or binary format up to 128 bits long. The scope then monitors the incoming signal, waiting until the desired pattern occurs. Once the pattern occurs, the data is saved to acquisition memory.
During troubleshooting, this function is useful for monitoring a bus to see if and when a particular data pattern occurs. By setting the scope to trigger only on a particular pattern, you know if and exactly when the pattern occurred.
Up to this point, we have covered the scope specifications necessary to accurately capture serial data bus signals and looked at generic scope features useful for analyzing and troubleshooting bus problems. Now let�s discuss the specialized bus functions that some scopes offer.
These scopes enable triggering on and analysis and search of I2C, SPI, and CAN events. Now, instead of searching for or triggering on a string of bits, the scope can be configured to trigger, for example, when a particular address occurs or if an acknowledgement is not received.
I2C Triggering and Analysis
I2C is a popular serial bus designed for bidirectional communications between IC devices. It consists of two lines: serial clock (SCL) and serial data (SDA). These lines connect to every device on the bus, and each connected device has an address.
The basic protocol of an I2C bus begins with a start condition followed by the 7-b address of the device being communicated with and then a read/write bit. After that, data is sent in 8-b packets, followed by an acknowledgement. Data transfer then is completed with a stop condition.
A scope with I2C-specific capabilities can be set up to trigger on a number of I2C events: every start condition, occurrence or absence of a user-defined address, occurrence or absence of one or two 8-bit patterns, non-acknowledge, a general call, a start byte, high-speed mode start, and combinations of I2C events and conditions on other scope channels.
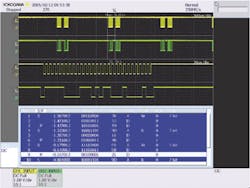
Once the I2C data is captured, protocol analysis can be performed on the data. The bottom section of the screen shown in Figure 2 displays the I2C information: location of start and stop conditions, timing which usually is relative to the trigger point, address and data information in hex and binary format, read/write information, and acknowledgement information.
After analyzing the data, you can search for a specific address, specific data events, or indefinite states. Indefinite states occur when signals are not high enough to be a legal high or low enough to be a legal low. For example, upper and lower threshold levels of 2.5 V and 0.5 V, respectively, are set. If the signal is above 2.5 V and then drops below 2.5 V but not below 0.5 V before going back above 2.5 V, this is considered an indefinite state.
SPI Triggering and Analysis
SPI, a general-purpose, full duplex, synchronous bus used to communicate between master control units and peripheral (slave) devices, comes in three-wire and four-wire configurations. All devices are connected to the same SCL; master output, slave input (MOSI); and master input, slave output (MISO) lines. Three-wire SPI will not have a MISO line.
Each slave device is connected to the master via a dedicated chip select (CS) line, sometimes referred to the slave select (SS) line. Communications between the master and a particular slave device occur when the CS line for that slave is active. Data is read on the clock�s rising or falling edge.
Oscilloscopes with SPI triggering can be set to trigger on an active CS line, one or more data patterns defined in hex or binary format, or combinations of SPI events and conditions on other scope channels.
Similar to the I2C discussion, scopes can analyze the SPI data and provide timing, data, CS, and start/stop information. The lower portion of the screen shown in Figure 3 displays the SPI information. Search functions then enable you to quickly find specific data events and indefinite states.
CAN Triggering and Analysis
The CAN bus, first developed for the automobile industry, has increased in popularity and spread into new industries over the last several years. It actually refers to two different physical-layer specifications: high-speed CAN (ISO 11898) and low-speed CAN (ISO 11519-2). Typically, scopes that support CAN bus support both specifications. CAN is an asynchronous bus using differential signals, CAN_H and CAN_L, that connect all devices on the bus.
Devices requesting information generate a remote frame. Remote frames also contain an ID field, an RTR bit, and a CRC field but do not have a data field. Error frames are generated when a problem on the bus is encountered. The error frame indicates what type of error occurred (active, passive, format, ACK, CRC, �).
Scopes supporting CAN triggering offer some or all of the following trigger conditions: start of frame, user-defined ID, RTR, user-defined data field, an error frame, and combinations of CAN events and conditions on other channels.
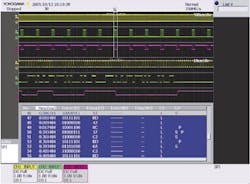
The analyzed CAN data shows what type of frame was transmitted (data, remote, error), timing information, ID, data, CRC information, acknowledgement, and error type (Figure 4). All of this information can be located using the search function.
Some scopes have a field jump function so you can easily navigate from one field in a frame to another. CAN cursors also can be used to move through the data one bit at a time.
Summary
Most electrical engineers at least occasionally use digital oscilloscopes. They know how important a scope is for looking at waveform behavior and determining waveform characteristics. A scope�s capability to zoom deep into a waveform to view specific bits of data or even edges of a single bit, analyze waveform parameters, and determine timing relationships can provide valuable insight into serial data bus performance. Some modern scopes with features such as cursors and triggers for general-purpose serial data patterns offer even more tools for analyzing serial buses.
However, when it comes time to look at protocol information on a bus, an oscilloscope may not be the first instrument to come to mind. That could begin to change as some scopes now offer in-depth serial bus triggering, analysis, and search functions. Rather than using a scope to look at physical waveform behavior and a protocol analyzer for protocol information, a high-performance scope with built-in protocol analysis capabilities can do both. The convenience and cost savings of using a single instrument when troubleshooting and analyzing serial buses can be significant.
About the Author
Boyd Shaw is the test and measurement product manager of Yokogawa�s digital oscilloscopes, function generators, and time-interval analyzers. Mr. Shaw has worked in the test and measurement equipment industry since 1996. He graduated from the University of Colorado with a B.S. in electrical engineering and a B.S. in business administration. Yokogawa Corp. of America, Test and Measurement Division, 2 Dart Rd., Newnan, GA 30265, 541-752-3849, e-mail: [email protected]
February 2006
