To address today�s image analysis tasks, you need a judicious mix of old methods and new techniques.
The purpose of analysis is to determine whether the results obtained from an operation are accurate, logical, and true. Engineers use analysis tools to monitor a given process. In machine vision, this process of monitoring is performed using image analysis tools. Thanks to faster CPUs, these tools have become more robust and more powerful, allowing machine vision to perform in more complex applications than ever before.
Image processing software comprises complex algorithms that have pixel values as inputs. Today�s image analysis software packages include both old and new technologies. Most significant is the relationship between the old blob analysis method and the new edge-detection technique.
Blob Meets World
For image processing, a blob is defined as a region of connected pixels. Blob analysis is the identification and study of these regions in an image. The algorithms discern pixels by their value and place them in one of two categories: the foreground (typically pixels with a non-zero value) or the background (pixels with a zero value).
In typical applications that use blob analysis, the blob features usually calculated are area and perimeter, Feret diameter, blob shape, and location. The versatility of blob analysis tools makes them suitable for a wide variety of applications such as pick-and-place, pharmaceutical, or inspection of food for foreign matter.
Since a blob is a region of touching pixels, analysis tools typically consider touching foreground pixels to be part of the same blob. Consequently, what is easily identifiable by the human eye as several distinct but touching blobs may be interpreted by software as a single blob. Furthermore, any part of a blob that is in the background pixel state because of lighting or reflection is considered as background during analysis.
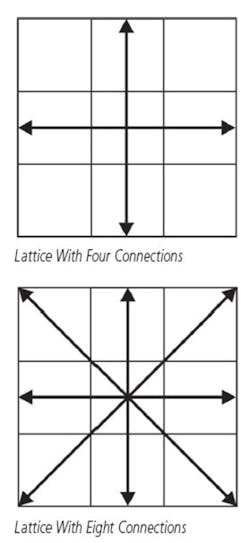
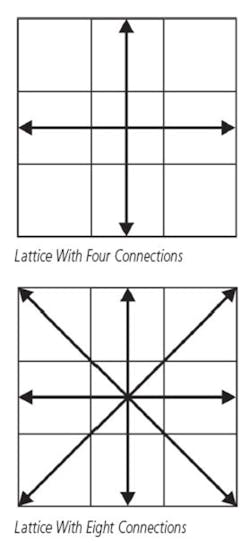
A reliable software package will tell you how touching blobs are defined. For example, you can define touching pixels as adjacent pixels along the vertical or horizontal axis as touching or include diagonally adjacent pixels (Figure 1)
Figure 1. Image of a Blob
Setting the rules for touching pixels is important because it can affect the outcome of the application. In Figure 2, for example, the group of pixels would be considered one blob if the specified lattice includes the diagonals but separate blobs if it does not.
The performance of a blob analysis operation depends on a successful segmentation of the image, that is, separating the good blobs from the background and each other as well as eliminating everything else in the image that is not of interest. Sounds easy, but without considering variables such as lighting conditions and noise in the image, you could include blobs in your results that you don�t want.
Segmentation usually involves a binarization operation. If simple segmentation is not possible due to poor lighting or blobs with the same gray level as parts of the background, you must develop a segmentation algorithm appropriate to your particular image.
The acquired image may contain noise or spurious blobs or holes that may be caused by noise or lighting. Such extraneous blobs can interfere with blob analysis results. If the image contains several extraneous blobs, you probably should preprocess the image before using it. Preprocessing refers to any steps made to clean up the image before analysis and can include thresholding or filtering.
Opening operations for non-zero valued blobs or holes or closing operations for zero valued blobs or holes help remove most noise without significantly altering real features. Preprocessing can be avoided by acquiring images under the best possible circumstances. This means ensuring that blobs do not overlap and, if possible, do not touch.
It also means ensuring the best possible lighting and using a background with a gray level that is very distinct from the gray level of the blobs. These steps add to the overall time required for analysis that, depending on the application, can be in the order of milliseconds.
For example, in a blueberry inspection system, the berries fall off a conveyor belt and are analyzed according to average hue, brightness, size, and roundness. This system offers only a 20-ms window for the analysis before the rejection stage. Ice chunks or twigs are rejected based on size and roundness as well as color through the blowing action of a bank of air jets programmed with their positions.
New Technology on the Edge
The introduction of edge-based processing into commercial off-the-shelf (COTS) development packages brought a series of high-performance, highly robust tools. While blob analysis concerns itself with regions of connected pixels based on their pixel value, edge detection is established from the intensity of transitions in an image.
Edge-detection tools are useful in applications that perform complex measurements, locate defects, or recognize and analyze shapes. At Matrox Imaging, we define edges as curves that delineate a boundary. Edges are determined from differential analysis and extracted by analyzing intensity transitions in images.
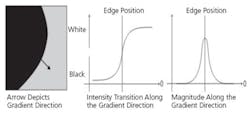
Strong transitions typically are caused by the presence of an object contour in the image although they also can come from many physical phenomena such as shadows and illumination variations. The main intensity transition in the image is observed in the perpendicular direction relative to the object border.
The contours of an object in an image are determined by calculating the gradient magnitude of each pixel in the image. The stronger the intensity transition, the greater the magnitude will be. The gradient magnitude is calculated at each pixel position from the image�s first derivatives. It is defined as:
where: ?x and ?y = the X and Y derivative values, respectively
They define the components of the gradient vector as:
An edge element (edgel) is located at the maximum value of the gradient magnitude over adjacent pixels in the direction defined by the gradient vector. The gradient direction is the direction of the steepest ascent at an edgel in the image while the gradient magnitude is the steepness of that ascent.
The gradient direction also is perpendicular to the object contour. Well-defined contours are extracted from strong and sharp intensity transitions. A strong contrast between the objects and their background improves the edge detector�s robustness and location accuracy (Figure 3).
Figure 3. Depiction of Edge Detection
A reliable tool should give results with subpixel accuracy. Since edgel accuracy varies with the image�s dynamic range, sharpness, and noise, well-contrasted, noise-free images will yield the best results. Under normal circumstances, you can expect an accuracy rate of 1/10th of a pixel to 1/40th of a pixel depending on physical limitations due to the transition�s dynamic range and the image�s noise. In perfect situations, the Matrox Image Library (MIL) Edge Finder can provide a subpixel edgel location accuracy of up to 1/128th of a pixel.
Unlike blob analysis, the feature-based algorithms used in edge detection remain robust in less-than-ideal light conditions and can locate predefined shapes regardless of angle. When deciding which tool to use, note that blob analysis takes less time than edge detection, but edge detection is more robust and can be simpler to use because segmentation is not required.
Case Study
Optical Systems Corp. (OSC) provides turnkey systems to manufacturers in the telecommunications and data-storage industries, both highly competitive markets. Last year, a disk-drive manufacturer approached OSC with a problem: The company�s image analysis systems no longer were precise enough for the new, smaller parts produced.
Current drive head sliders measure 0.7 mm � 0.85 mm. Like a needle on a record player, the slider is a tiny rectangle of silicon glued to the end of a suspension arm that holds the slider just above the magnetic media. As the disk spins, the read/write head (slider) glides over the disk.
OSC developed a system called an automated slider sorter, which is a high-speed pick-and-place system. The three-camera system picks up the tiny rectangular sliders with a robot; aligns them along the X, Y, Z, and rotation axes; reads their serial numbers; and finally places each part into a tiny pocket on an adjacent tray.
The main challenge was performing this operation in 1.5 seconds per part. With each slider the size of a grain of pepper, reliable motion control and vision alignment were absolutely necessary.
The automated slider sorter features an Advantech 3.2-GHz rack-mount PC, motion-control hardware from Delta Tau (UMAC, WSPQ1014-G), four LM-310 Linear Motors from Trilogy Systems, three SENTECH STC-400 Cameras, one CCS America HLV-24-RD Light Source, a Matrox Orion Frame Grabber, and the MIL Development Kit.
The automated slider sorter is used after the wafer is lithographed, cut, and tested. A typical tray will contain an array of 50 � 80 sliders, and those 4,000 parts must be sorted according to serial number. During the sort operation, this large tray is manually placed in the center of the machine and surrounded by 16 smaller 20 � 20 trays.
The MIL blob analysis tool has a large role in the pick-and-place operation. A pre-scan locates the parts in the pick tray so the robot has the X-Y coordinates to grip the parts by means of a microscopic vacuum tip that must hit the part dead center or the slider isn�t picked up correctly, if at all. The vacuum tip must be within 25 to 50 microns of center to be successful.
In the next step, an upward-facing camera takes a magnified image for part rotation. Again the angle is calculated from the results of a second blob analysis operation.
Next, a third camera perpendicular to the X-axis plane of the device helps the robot shift the part to its precise Y-coordinate to read the part�s serial number with the MIL optical character recognition (OCR) module. The system then sorts the sliders into the smaller surrounding trays according to serial number.
The Obsolete and the New and Improved
With a plethora of disk drives available on the consumer market, OSC designed the automated slider sorter with enough flexibility to account for products such as desktop, external, and mobile disk drives. To maintain its competitive edge, OSC must be ready for future specifications such as increased disk capacity, lower cost, and faster data access.
OSC�s original customer has purchased six systems to date, all of which are deployed in the field. An additional 17 systems are on order.
The End Result
Blob analysis is just one example of the image processing tools available today. But with modern CPUs, edge-based image processing algorithms offer unprecedented performance. A blob analysis tool will find objects in a scene but might not be robust enough if the environmental conditions change. In all likelihood, you will need to implement multiple tools.
About the Author
Sarah Sookman has worked at Matrox Imaging as both a technical and marketing writer since 1998. She holds a bachelor of education degree from McGill University in Montreal. Matrox Imaging, 1055 St-Regis Blvd., Dorval, Quebec, H9P 2T4 Canada, 514-822-6000, ext. 2753, e-mail: [email protected]
FOR MORE INFORMATION
on the Matrox Imaging Library
www.rsleads.com/608ee-193
Optical Character Recognition
Feature-based OCR uses a different approach. The algorithms first extract the features that make up a character and then identify that character. The OCR tool should be robust enough to read characters in poor or nonuniform lighting at any scale factor in the X and Y axes, allowing for deformities such as perspective distortion and different aspect ratios. Because of the OCR�s robustness to scale variations, developers benefit from a much simpler method for font definition.
August 2006
