Still using the same old test tools? New boundary scan software can improve your efficiency.
When ProVision starts, the Guide wizard asks you whether you want to open an existing project or create a new one. Starting a new one automatically assigns a project name that you can alter. A project file of that name will be located in the projects folder. All files relevant to the board or boards being tested will reside within a project data folder. They are distinguished by name and extension type. For example, the project file extension is .jtp (JTAG project).
In earlier implementations of boundary scan testing, many file types were associated with separate parts of the testing process. One of the major advances made by ProVision is the elimination of most of these unique file extensions. This has made data entry and test development more straightforward.
Projects
A PCB design is defined by its netlist and layout. The Visualizer program, which can be used in conjunction with ProVision, assists in correlating electrical faults with their physical location. For this, physical layout information is needed in addition to the schematic. It�s not necessary to describe the physical layout for ProVision because boundary scan tests only depend on the electrical connections within nets, not the physical locations of the connected components.
A separate netlist file is required for each board in the project and asked for at this stage. Both board name and board type can be specified. This facility is useful, for example, if several boards of the same type are being tested as a group. Each would be given a different name such as board_1, board_2, and board_3, but they all could be of the same type. This facility also is useful for daughter cards, external test fixtures that contain boundary scan components, and multichip modules (MCMs).
For mainly historical reasons, there are a great many formats of netlist data. ProVision accommodates more than 33 types, so chances are that yours will be included. You use the browse facility to locate the relevant file for each board and then import it while also specifying the type of platform that generated the netlist, such as Allegro or Cadstar. That�s all ProVision needs to translate and understand the netlist.
Once ProVision has read the netlist file, a list of the device types used on the board will be displayed. For those that include boundary scan capabilities, you must provide a boundary scan description language (BSDL) file. Non-boundary scan device models usually can be selected from an extensive library that was installed as part of ProVision or created by using the Model Editor wizard.
Models are not absolutely required. You can manually enter the descriptive information into the NetExplorer tool without creating a model. Models just allow the reuse of this information in all future designs. Models are only beneficial for devices that interact with the boundary scan chain, and ProVision tells you which devices these are.
When all the device types together with their models, connectivity, and BSDL files have been entered into ProVision�s database, you are asked if you want to start the Application wizard. Starting ProVision or selecting the Guide wizard from the Project menu prompts you for the relevant board and device input data, which only needs to be entered once. The Application wizard similarly helps you through the test-development process.
Applications
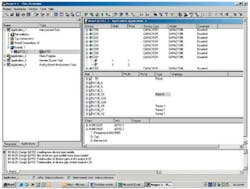
You begin by choosing the type of application from among four basic categories: Interconnect Test, Cluster Test, In-System Flash Program, and In-System PLD Program. Interconnect tests have three varieties catering to board-to-board, pull-up/pull-down resistors, and basic interconnect. Cluster tests are generic or memory-oriented. And, there are three varieties of PLD programming corresponding to JEDEC, IEEE 1532, and serial vector format (SVF) conventions (Figure 1).
Figure 1. NetExplorer Screen for an Interconnect Test Application
Click here for larger image
The Interconnect Test is used to detect faults on nets that can be directly controlled and observed by boundary scan register cells. Typically, not all components on a board are controllable, but many of these may be connected to components that are controllable. ProVision will determine the groups of interconnections that can be controlled and display these as separate boundary scan controllable nets.
After you provide the test name, the Application wizard asks if you want to use the project or advanced configuration. The project choice assumes the test will apply to the board or boards defined in the current project. The advanced choice allows the previously defined project board to be changed. In either case, the last screen displays the settings that will control the test. A third alternative is to copy the board settings from another application.
The default settings do not apply a walking one or zero memory test although this functionality is supported. Potential driver conflicts also are not allowed. Only safe patterns are used to identify stuck-at and bridging faults. The option is given to allow conflicts, but this choice would be made after resolving test warnings and ensuring that conflicts would not harm the UUT.
Before any of these applications can be run, an infrastructure test is performed to ensure that the boundary scan chain is working correctly and that you have correctly connected the boundary scan controller test access port (TAP) signals. There are three parts to the infrastructure test: capture, identification, and TAP reset (TRST).
The capture test verifies the individual test mode select (TMS), test clock (TCK), test data input (TDI), and test data output (TDO) connections on each individual boundary scan component. For boundary scan-controllable devices, the identification test confirms that the correct parts have been used in constructing the boundary scan chain. The TRST test pulses the reset line on any boundary scan-controllable device and verifies that the output changes as expected.
Your test configuration may not be as simple as the direct connection ProVision initially assumes between the tester TAPs and your board nets. To change the type of connection, you select a more appropriate descriptive icon from the TAP toolbox display and drag/drop it onto the net in question. For example, after removing the tester connection to the first net, you could modify the TAP connection description to show the use of an extender. Or, you might simply want to connect the first net to TAP2 and the second net to TAP1. Applications modified in this way must be regenerated to register the changes.
In many cases, a cluster test can address sections of a design that are not controllable themselves but are connected to controllable nets. ProVision tabulates expected outputs vs. test inputs for a cluster and highlights any deviations as the test is run. Cluster tests are important because they increase test coverage even though the components in question are not themselves boundary scan controllable.
For all types of tests and in-situ programming, the Application wizard guides you through the required steps and provides prompts for the necessary information. Using the wizard ensures that if each stage has been successfully completed, the final application should run correctly.
The User Interface
ProVision displays five menus: Project, Application, Windows, Tools, and Help. Within the Project menu, you can select the Guide wizard, open a specific project, and manage or reload device types. The save/save as, expand/collapse views, and preferences utilities also appear on this menu.
The Application menu controls application generation, execution, and re-execution. When a test is run for the first time, it will create a yellow warning dialog and an exit code of 3 in the execution log. This is because the test was first compiled. Re-executing it clears the irrelevant warning. You can run the infrastructure test from the Application menu. This menu also provides the capabilities to define a new application and modify or delete an existing one.
All operations you have performed in ProVision are logged in the output area near the bottom of the display screen. In addition, all the windows remain open that were created when different applications were run and device models updated, for example. The Windows menu allows you to manage these windows by tiling vertically or horizontally, cascading, or closing the windows. You also can clear all log views or capture the screen as a JPEG image.
The tools menu supports selection of the Tap Connector, NetExplorer, Device Type Manager, and Board Connections tools and the Model Editor wizard. Because there are many details to a device description, using the Model Editor wizard ensures that the final model is complete. If you are testing two or more boards connected together, you need to use the Board Connections tool.
The Device Type Manager is a windows explorer-like tool that supports browsing to locate the relevant device description file. In addition, this tool maps company-specific part numbers to the models in the ProVision model library. Many companies have their own part-numbering system that has little or no relationship to recognized industry part numbers. Mapping via the Device Type Manager results in a file that can be used in all future designs for that company.
NetExplorer presents four views of the project information as shown in Figure 1: the chain, device type, device, and netlist views. You use the menu or toolbar to control which views are displayed. The board targeted by NetExplorer is selected from the relevant application. Because warnings and TAP settings are displayed as well as basic device and net information, the NetExplorer views can be customized to a given application.
Three ways are provided to select a tool and/or view. You can expand an application�s attributes to show the TAP connections and board name. Double left clicking on the TAP connections icon, for example, will cause the TAP connections tool to be displayed in the workspace area. Alternatively, you can simply highlight the relevant board within an application and then select the appropriate tool via the toolbar icons or directly from the Tools menu.
Right clicking in the area of the screen containing the menu names will display a list of the available toolbars from which you can customize your screen. The Result toolbar and Truth Table Reporter (TTR) are items that do not appear on the Tools menu. Using the result toolbar icons, you can start the TTR and analyze the test results it displays. You also can output test results in the HTML format for viewing on any computer that does not have ProVision installed.
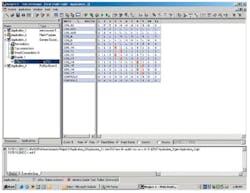
After running a test, the states of the separate nets are displayed relative to the individual boundary scan vectors (Figure 2). Using the TTR toolbar icons, either quantity can be displayed on either axis and separate nets highlighted. Also, you can filter test results to show only failing nets or failing vectors.
Figure 2. Test Truth Table Screen for a Failed Cluster Test Application
Click here for larger image
Summary
Boundary scan testing began as a means of verifying that all the connections to board-mounted devices had been formed correctly during manufacturing. This still is a major benefit, but in addition to various types of tests that can be performed, applications include flash and PLD programming.
Complete descriptive files, correct in every detail, are required for boundary scan testing to be effective. Through its use of wizards, ProVision provides an integrated environment that helps you gather together the relevant information.
Because ProVision is database oriented, a number of complementary views of the board test data are possible. These are provided via flexible tools that also allow for data and test modification and that use icons extensively. Although these may be overlooked by the casual user, their meaning is significant and contributes to power user efficiency.
In addition to its design relevance, ProVision can be used in conjunction with JTAG Technologies� AEX Manager software application in a production environment. A sequence of tests is defined and the results directed to a report. You can run the test sequence from the standard GUI or one you have created in a LabVIEW, LabWindows, TestStand, C, or Visual Basic environment. This capability allows you to integrate boundary scan tests into other systems such as functional testers, in-circuit testers, and flying-probe systems.
FOR MORE INFORMATION
on ProVision
www.rsleads.com/608ee-176
August 2006


