To analyze HDMI cable assemblies, couple time-domain measurements with modeling software.
The high-definition multimedia interface (HDMI) is an emerging consumer electronics standard that offers the first industry-supported, all-digital audio/video, one-cable interface. It supports data rates as fast as 5 Gb/s through a single connector instead of several cables as used in the past. Consequently, HDMI cables require careful design and analysis techniques to ensure that they pass required compliance tests.
The time-domain reflection and transmission (TDR/T) measurement of the HDMI cable helps locate and model discontinuities caused by the geometrical features of a connector and frequency-dependent losses of a cable itself. In cases where it is not possible to measure TDT data directly, an accurate prediction of the transmission behavior can be made.
Moreover, topological models can be built for each part of the HDMI cable assembly, verified with the measurement data, and then used to predict time- and frequency-domain response for a longer HDMI cable. The topological modeling methodology can accurately approximate the electrical behavior of the DUT even before the longer prototype is manufactured.
A 3-meter-long cable is used to build a topological model from TDR data. The model is scaled up and electrical performance predicted for a 10-meter-long prototype. The SPICE simulation linked with IConnect modeling software1 shows correlation between the prediction and the actual TDR/T measurement for a 10-meter-long HDMI cable assembly in the time and frequency domains. The circuit model generated from TDR measurements allows an eye diagram to be obtained, which then is compared with an eye diagram generated from TDT measurements for the fabricated HDMI cable prototype.
Such an eye diagram can be generated directly from TDT measurements, but the TDR-only approach works best when only one side of the DUT is accessible. The result of an eye mask test from model prediction agrees with the test performed for the fabricated prototype. This technique allows a designer to quickly accomplish interconnect modeling and analysis tasks, resulting in faster design time and lower design costs.
TDR Measurements
The TDR measurements normally are done with a time-domain sampling oscilloscope such as Tektronix TDS8200 or similar. This instrument is a very wide bandwidth equivalent-time sampling oscilloscope with an internal step generator.
The TDR sends a step stimulus to the DUT. Based on reflections from the DUT, a designer can deduce a great deal of information about the DUT�s properties such as location of failures, DUT impedance, and time delay, and he can generate an eye diagram for the system.2
An engineer also can use TDT measurements to measure crosstalk or characterize lossy transmission line parameters such as rise-time degradation and insertion loss as well as skin effect and dielectric losses. The frequency-dependent behavior of the system can be calculated from the time-domain (TD) measurements using the time-domain network analysis technique (TDNA).3
The TDR measurements are visual and intuitive to the digital designers due to the transient nature of this technique. As the incident step propagates through the discontinuities in the DUT, it causes the reflections that indicate the exact locations of discontinuities and their sizes. The fast TDR rise time provided by the sampling oscilloscope ensures that a wide range of frequencies is captured during this broadband measurement.
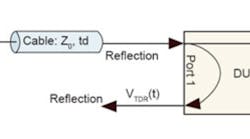
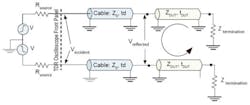
A generalized diagram of a TDR/T measurement setup is shown in Figure 1a. Any of these measurements can be performed in a differential or single-ended fashion. The differential-, common-, or mixed-mode measurements require at least two synchronized sources and a four-port measurement setup as shown in Figure 1b.
Figure 1a. General TDR and TDT Block Diagram
Figure 1b. Block Diagram for Measurements of Coupled Interconnects
The TDR/T response of the DUT not only allows an engineer to observe different discontinuities and characterization of the HDMI interconnects, but it also enables him to quickly create topological models. The topological models capture the distributed nature of the high-speed interconnects and allow determination of a precise impact of each discontinuity on the overall performance of the DUT. Modeling software uses the TDR/T modeling techniques to generate and analyze topological models of various interconnects including the HDMI cable assemblies.
Differential Impedance Modeling Of the HDMI Cable
The HDMI standard uses transition minimized differential signaling (TMDS) technology that provides differential signals with nominal amplitude transitions of 500 mV. If just the differential signaling is considered, then the interconnect can be reduced to a two-port structure, and the model can be built using just differential TDR voltage waveforms. If the HDMI test fixtures are not available, a differential probe connected to the desired channels at the reference plane can be used.
In this modeling example, a differential probe is used to obtain the differential TDR response of a 3-meter-long HDMI cable. If the second probe is available, the differential TDT can be acquired as well, and insertion loss and the eye diagram of the cable assembly can be obtained directly from the measurement without resorting to the modeling process. The combination of two models, a connector model and a lossy cable model, then is used to predict both S-parameters and an eye diagram of the interconnect.
The modeling process starts from modeling losses for the HDMI cable. IConnect software uses two approaches to extract the losses: matched and open. In a matched approach, both TDR data and TDT data generate a lossy-line model.
The open approach can be handy in cases when it is not possible to acquire a transmission waveform because it uses reflection data with the other port kept open to generate an accurate model. The losses in this approach can be extracted and optimized based on the information from the signal�s rise-time degradation and the slope of the TDR voltage in the DUT�s region.
The TDR data for the open-ended configuration is acquired using a time-domain sampling oscilloscope and loaded into the software�s lossy-line modeling tool. The software then extracts the RLGC losses for the DUT.
The correlation is excellent in terms of the rise-time degradation and modeling of the TDR�s slope; however, the connector�s reflections are not modeled in this case. This also is observable in the frequency-domain correlation; the depth of the modeled resonances is smaller than the depth of the measured ones. This behavior is accurately captured when the connector�s reflections are modeled using pieces of the ideal transmission-line models or lumped elements.
The approach to model reflections is best used when the true impedance profile generates a model for each discontinuity in a connector-cable transition of the HDMI cable assembly. To generate such a model, only the TDR data is required.
The discontinuities of the connector-cable area are modeled using sections of the ideal transmission lines; however, lumped element topologies can be selected as well. After the model�s parameters are adjusted, this model can be combined with the lossy-line model to represent both losses and reflections and predict S-parameters as well as the eye diagram for the cable under test.
Models for the connector�s reflections and the cable�s losses can be combined in one composite circuit. The length of the lossy-line model can be scaled down by adjusting loss parameters of the model to fit the connector models. There is no need to create another model for the connector-cable transition because two connectors normally are identical for both sides of the cable.
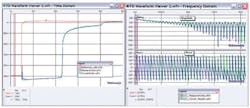
For this reason, the model can be reused by interchanging the port direction in the subcircuit�s netlist. The SPICE circuit simulation of the final assembly model reveals excellent correlation in both the time and frequency domains shown in Figure 2.
Figure 2. Time- and Frequency-Domain Correlation of the Model Assembly
Click here to see larger image
Once an accurate model is created, it can be used to predict an eye diagram and S-parameters for the cable under test. To extract two-port S-parameters and an eye diagram, both TDR and TDT responses of the HDMI cable model are required.
By the definition of S-parameters, the response is measured when all ports are terminated with matched terminations.4 This is simply done by changing the termination impedance in the composite model and simulating the response. The SPICE-simulated TDR/T waveforms then are used to compute S-parameters.
Fully Coupled Modeling Of the HDMI Cable
Although a differential model can be used efficiently in the system�s simulations, a fully coupled model provides more accurate representation of a device�s performance. Signals that propagate on differential lines can be decomposed into even- and odd-mode components. So, if the model is capable of accurately capturing these two modes of propagation, then any signaling can be accurately represented in circuit simulations.
Separate models for the reflections and losses must be created first, then combined into one model assembly. After the coupled models are built, they have to be compared with measurements in both modes of propagation.
The measurements should include both even- and odd-mode responses, and the models can be built based on TDR only or on TDR and TDT measurements. In this example, the model is built assuming the minimum availability of the measurement equipment, that is, differential TDR capability only.
The TDR data is acquired for both odd and even modes of propagation. The odd mode is excited by setting opposite polarity steps and acquired by using the difference between two channels. The even mode is activated by using the same polarity signals and acquired by summing the TDR responses of channels one and two.
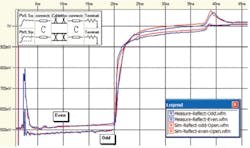
After accuracy of the models for both reflections and losses is verified, they can be combined into one model assembly shown in Figure 3. The model assembly shows excellent correlation for both the even and odd modes of propagation in terms of RLGC losses and reflections.
Figure 3. Time-Domain Correlation and Fully Coupled Model Topology for HDMI Cable Assembly
Model-Based Prediction of an Eye Diagram
The eye diagram test is another key measurement required by the HDMI signaling standard. The measurement of the eye diagram captures the deterministic jitter in interconnects caused by interconnect crosstalk, losses, and reflections. Since the transfer characteristics of a cable assembly contain all the information required to reconstruct this deterministic jitter, the eye diagram computed from the TDT measurements using a TDR oscilloscope is as valid and accurate as the eye diagram obtained using a pattern generator and a sampling oscilloscope.
Modeling tools of the software can be used to estimate an eye diagram of a long cable from the measurements of a short one, enabling a designer to predict interconnect performance before even manufacturing it. This is done by creating an accurate model for the short interconnect using a topological modeling approach and scaling up the lossy-line model to represent the longer cable assembly.
In this section, a 3-meter-long HDMI cable is used to predict an eye diagram of a 10-meter-long cable. Then the actual measurements of a 10-meter long cable verify the prediction.
To build an eye diagram from the time-domain measurements, both reference and transmission waveforms are required. The reference waveform can be acquired from the open configuration with the DUT disconnected while the TDT waveform can be obtained from the SPICE simulation of the scaled model using the reference waveform as a source signal.
The TDT response is saved and used to generate a transfer function required for the eye diagram. It then is generated according to the compliance specifications.
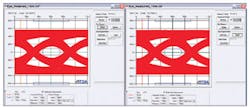
Figure 4 shows the modeled eye diagram for a 10-meter-long cable. The measured eye diagram is almost identical. The scaled model provides a reasonable estimation of the actual 10-meter-long cable performance. The eye diagrams are generated at a 1.65-Gbs data rate and 200-ps 20% to 80% rise time.
Figure 4. Correlation of an Eye Diagram Obtained From the Scaled Model With the Eye Diagram Obtained From the Actual Measurements of the 10-Meter-Long Cable
Click here to see larger image
Conclusion
Time-domain measurements coupled with modeling software can be efficiently used to perform an analysis of the HDMI cable assemblies. Accurate two-port differential models can be quickly built from TDR-only measurement data. The designer also can build coupled models from even- and odd-mode TDR measurements and then reuse those models to predict both insertion and return losses of the cable assembly. Finally, the topological models can be scaled up to accurately predict performance of the longer cables.
References
1. Tektronix.
2. �Eye Diagram Measurements Using TDR Oscilloscope Transmission Data,� Application Note, Tektronix.
3. �S-Parameters, Insertion, and Return Loss Measurements Using TDR Oscilloscope,� Application Note, Tektronix.
4. Ramo, S., Whinnery, J.R., and Van Duzer, T., �Fields and Waves in Communication Electronics,� Third Edition, 1993.
About the Author
Eugene Mayevskiy is an applications engineer with the electrical optical product line at Tektronix. He holds B.S.E.E and M.S.E.E. degrees from Oregon State University where he completed research on measurement-based modeling and analysis of passive devices fabricated for radio-frequency integrated circuits. Mr. Mayevskiy also has published a number of papers and given seminars on measurement-based modeling for high-speed designs. Tektronix, 14200 SW Karl Braun Dr., P.O. Box 500, Beaverton, OR 97077, 800- 835-9433.
FOR MORE INFORMATION
on HDMI cable modeling
www.rsleads.com/609ee-198
September 2006
