Commercial and military/aerospace electronics manufacturers typically perform EMC tests on all new devices they design and develop. Some manufacturers also must do periodic checks on current production equipment to comply with new or changing regulations or military contracts.
As a result, the facilities that perform the EMC tests are facing numerous business pressures. For example, commercial standards that cover up to 26.5 GHz require new equipment. As the electronics manufacturers introduce more products, the demand for testing grows. As the demand grows, EMC testing can become a critical path in launching a new product.
To minimize the testing bottleneck, the equipment under test (EUT) must pass compliance testing without any issues. That is difficult to imagine considering the complexity of today�s electronics systems. One solution is to use a signal monitoring system as a pre-scan tool to find radiated emissions in an open-air environment or short-duration emissions in a chamber.
Pre-Scan Testing
The intent of pre-scan testing is to get a rough approximation of the EMC margins and problem areas of the EUT. Many design changes may be suggested by examining the suspect frequencies of emitted signals.
The price of pre-scan tools is a fraction of the overall cost of full compliance testing equipment. But, what equipment is realistic, affordable, and useable outside of the testing facility or in an open range?
Spectrum analyzers and signal monitoring systems can easily identify radiated emissions broadcast from the EUT through space. Both cover the common frequency ranges of 30 MHz to 2.7 GHz and testing standards with frequencies up to18 GHz and higher.
Spectrum analyzers are very familiar to test engineers and require little explanation. Not only do they accurately find signals emitted from the EUT, but they also see the entire RF environment.
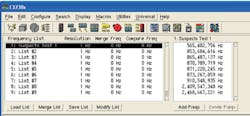
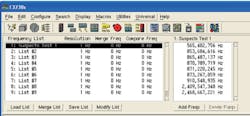
A signal monitoring system is a less-known tool for use in pre-scan, but it provides a unique capability to find problem or suspect signals in an open-air RF environment. For example, a signal monitoring system can identify new energy above an environmental-based threshold and record the frequencies in a list (Figure 1).
Figure 1. Suspect Frequency List of Signals Above Threshold
Most spectrum analyzers are swept or have enhanced FFT modes for higher speed measurements so they may not find short-duration emissions as they are sweeping through the spectrum. A signal monitoring system can find transient or short-duration signals caused when the EUT is commanded to perform a function, power is turned on to the EUT, or the turntable is moving.
The system can monitor a 1-GHz spectrum with a 2-kHz resolution bandwidth in about 250 ms. It also can park on any 36-MHz-wide section with 1-ms scan time without losing data. This high speed lets you capture short-duration emissions without giving up the high resolution needed to see signals next to other signals or near to noise.
The signal monitoring system�s high speed and resolution come from an architecture that combines FFT with rapidly stepped local oscillators to quickly revisit sections of the spectrum. At each step, the system processes the equivalent of many swept resolution bandwidth filters in parallel using a powerful FFT engine.
The front-end tuning hardware has a very short settling time so frequency steps are very fast. Each section of the spectrum is down-converted to a wide IF bandwidth output that is digitized. The digitizer must have a high dynamic range, a digital filter, and resampling capability to accurately digitize all of the signals in each frequency step.
Large amounts of spectrum data are sent to the processing components with high-speed I/O and significant embedded signal processing power. Multiple digital signal processors working in parallel compute the spectrum information from raw time data including the base FFT analysis at up to 10-GHz/s sweep rates.
Setup for EMC Pre-Scan
Signal monitoring systems are connected to the antenna as you would a spectrum analyzer. Using a table of values for various frequencies, correction factors are loaded into the software taking into account the antenna, cable, and amplifier characteristics. Although the measurement errors between the antenna and the instrumentation may be reasonably small, the largest unknown is the relationship between the signal radiated at the EUT and the signal received by the antenna.
With the EUT power turned off, the signal monitoring system will take a baseline measurement of the RF environment. Since variations in RF background make finding EUT emissions difficult, allow 20 s or 30 s to make the measurement. Longer periods of time may be used to capture intermittent background signals such as navigation and air traffic control, mobile transmissions, and machinery noise in the ambient measurement.
This measurement is used as the environmental threshold level so only the EUT signals that appear above the threshold will be considered suspects. The environmental threshold allows this pre-scan tool to be used in an open site or on a lab bench.
Not only are the ambient RF signals stored in the baseline, but any interference unrelated to the EUT in its power-on condition also is stored. For example, noise and spurious signals from nearby equipment will be included in the ambient environment.
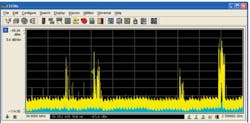
In Figure 2, a typical threshold level is shown in yellow for an ambient measurement of 20 MHz to 1 GHz. This threshold level in the signal monitoring system is stored at a very high resolution for identifying energy that appears above the threshold.
Figure 2. Threshold Level for a Wide-Span Measurement
Measuring EUT Emissions
With the threshold set, turn on power to the EUT and start the signal monitoring system to detect energy and signals above that level. These suspect signals above the ambient should be stored in a database or frequency list.
A narrow-resolution bandwidth is needed to differentiate signals, particularly in an open site. Strong background signals such as FM broadcast transmissions may cause compression and false indications in lower-cost spectrum analyzers.
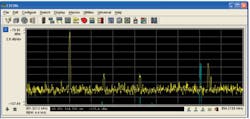
EUT emissions may be buried under the background interference if frequencies coincide. Figure 3 shows how the signal monitoring system using its high resolution can identify signals very close to large transmissions.
Figure 3. Narrow-Resolution Bandwidth Resolving Small Signals
Engineers can easily move the EUT or antenna to look for the strongest emissions from the rear panel, the front panel, or slots in the shielding. System setups can be stored along with recorded signals and spectrum data.
Engineering Judgment Applied to Pre-Scan
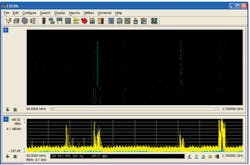
Since the signal monitoring system is not an EMC analyzer, engineers must use judgments and calculations to determine what signals could be eliminated or reduced. For example, the spectragram display of the signal monitoring system is useful to see signals above the threshold vs. the time that has passed (Figure 4). Multicolor displays can show the strength of the signal above the threshold.
Figure 4. Frequency vs. Time Spectragram
If there were some slow movement of equipment on a rotating table, the signal monitoring system could identify the transient emissions during the rotation because of its fast sweep time. If the antenna is moved or changed, the system also can continue monitoring for emissions. Applying engineering judgment to these dynamic measurements might allow test engineers to identify emissions under unusual circumstances.
Most signal monitoring systems can recognize modulation formats, particularly those used in digital communications. By recognizing modulation of signals, you can determine if it is less likely the signal is emitted from the EUT. For example, RF emissions from most devices will not include digital modulation, so it could be eliminated quickly as a suspect frequency.
Maybe you are unsure if the signal detected is ambient or from the EUT. Simply stop the energy detection of the signal monitoring system and store the results and settings. Turn off the EUT and start the signal monitoring system�s energy detection again. During the next high-speed scan of the spectrum, the suspect signal will either disappear or remain.
Some EUT might have transient behaviors that generate short-duration or intermittent RF emissions. Application examples include turning on a large complex electronic system in an airframe using a startup sequence or commanding an inkjet printer to print.
The classical measurements using swept spectrum analyzers cannot show these intermittent signals unless the frequency span is reduced or the resolution bandwidth is increased. Compared to traditional spectrum analyzers, signal monitoring systems can discover many more short-duration or intermittent RF emitters caused by dynamically operating the EUT.
Some EUT may transmit broadband noise that could be confused with the environment. A signal monitoring system can easily be adapted to include flexible thresholds, frequency ranges, and bandwidth settings. Pre-scanning is a discovery process of finding emissions; it requires experimentation and engineering judgment.
Conclusion
A new measurement tool called a signal monitoring system can be used effectively and efficiently to find RF emissions when developing new electronics. This system can be used as a pre-scan test to identify suspect frequencies from the EUT that might need further analysis.
The Agilent E3238S Signal Survey System has a wide bandwidth, a high-speed search, and high resolution for identifying, troubleshooting, and resolving EUT transmissions. Its high-speed wideband survey of the RF emissions allows engineers to see very short duration signals, and high resolution can find small signals close to large signals or small signals near to the noise floor.
Using a signal monitoring system can reduce the bottleneck in EMC compliance testing, provide new insights on emissions, and keep projects on schedule.
About the Author
Chris DeSalvo is a product marketing engineer for the Signal Networks Division at Agilent Technologies. He has a B.S. in electrical engineering from the University of Pittsburgh. Agilent Technologies, Signal Networks Division, 900 S. Taft Ave., Loveland, CO 80537-6378, 800-829-4444, e-mail: [email protected]
June 2007
