The Effect of Filters in Mobile Radio Systems
The design and verification of today’s complex digital communications systems present a multitude of interesting challenges. A particularly difficult problem is the impairments caused by RF components such as filters and amplifiers included in the signal path as well as interfering signals that pass through the RF link. Linear devices such as filters typically add phase distortion and group delay to the signal, and nonlinear components such as amplifiers cause intermodulation (IM) products that generate additional harmonics.
A BER of 10-5 is typical for a satisfactory audio signal quality. BER is investigated using different filter types and the effect of amplifier distortion on RF front ends for third-generation (3G) mobile radio systems such as wideband code division multiple access universal mobile telecommunications systems (WCDMA-UMTS).
For WCDMA base stations, a single filter can be used for each channel. Designers typically use Chebychev or Cauer-Chebychev filters in the received path for protection against out-of-band signals.1,2 However, the poor group delay characteristic of these filters can degrade the desired waveforms and result in a higher BER.
The Signal
The chip rate for WCDMA is 3.84 megachips per second (Mc/s). The typical bandwidth of this signal is 4.2 MHz, and the standard channel spacing is 5 MHz. The 4.2-MHz bandwidth is due to the pulse shaping used on the I and Q branches.
The demodulation of the signal creates I and Q data streams. A BER measurement then can be performed on the received data. In a practical receiver, forward error correction (FEC) and interleaving also are used, and these will have a further impact on the final BER result.
Simulation Comparison of Filters
AWR’s Visual System Simulator™ (VSS) was used for the filter simulation comparison because of its ease of use and integrated cosimulation capability as well as its affordability through the company’s Educational Software Program.3 The VSS provides automatic data-alignment for BER simulations using signal generators and the I/Q demodulator to automatically align transmitted-to-received data before performing a BER simulation so that component trade-off studies can easily be performed.
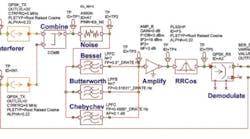
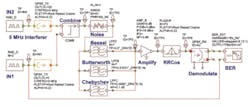
In the simulation shown in Figure 1, the behavior of Bessel, Butterworth, and Chebychev filters, whose function is to protect the front-end mobile base station from interference, was analyzed. The effect of amplifier distortion also was investigated.
Figure 1. Block Diagram of Simulation Using VSS
The WCDMA RF transmitted signal can be generated in the VSS as a WCDMA physical layer 1-compliant signal. To simplify the problem and highlight the differences in BER due to the filters, a quadrature phase shift keying (QPSK) modulator with a chip rate of 3.84 Mc/s followed by a single filter for each channel was used to obtain the simulation results. As is normal for communications-system simulations, the desired generated QPSK signal was centered at DC, and low-pass filters were used. The resulting spectra were the same regardless of the center frequency setting. A sampling rate of eight times the chip rate was used throughout all simulations to ensure accurate waveform information.
In Figure 1, the desired information (IN1) and interferer (IN2) are independent random binary data generators. The QPSK modulators (QPSK_TX) generate modulated signals with the WCDMA chip rate of 3.84 Mc/s. For WCDMA-UMTS, a root raised cosine (RRC) pulse shaping filter with ? = 0.22 was used.
In this practical receiver system, the signal from the antenna is filtered by the Bessel, Butterworth, or Chebychev RF filter being considered for that simulation. The output from that filter then is amplified, frequency shifted, and digitized. Just prior to demodulation, the signal passes through the complementary RRC filter.
The desired and interfering signals in Figure 1 are combined, and a variable amount of noise is added. The interferer is set to an offset of 5 MHz from DC, corresponding to the channel spacing of WCDMA-UMTS, and its power level is varied to study the effect of adjacent channel interference.
The BER results were determined using the BER measuring block as the noise and interference were varied. The amplifier block was a general-purpose amplifier, modeled as a fifth-order polynomial where the 1-dB compression point second-order and third-order IM distortion can be adjusted.
To ensure correct synchronization of the BER meter and provide accurate results, only one of the Bessel, Butterworth, or Chebychev blocks or no filter is enabled at a time. The data from these single-trace BER measurements was combined to produce the final results. For these results, a minimum of 500 errors or 5 million data samples was required for each plotted data point on the BER curves. Since the error occurrences were random, there were small random variations in the plotted BER curves.
Basic Filters
Seventh-order low-pass filters that corresponded to seven resonator filters on a base station were used for this simulation. A passband ripple of 0.1 dB was used for the Chebychev filter. This ensured that the increase in the receiver noise figure due to the passband insertion loss caused by the ripple was kept to practical limits.
Since the BER depends on the cutoff frequency of the filters, suitable frequencies must be selected for a fair comparison to be made between the filter types. The cutoff frequency of each filter was chosen so that, if the same uniform spectrum was applied to each of the filters, the total output power from each filter would be the same. This corresponds to a cutoff frequency of 0.5 x 3.84 MHz = 1.92 MHz for the Bessel filter, 1.98 MHz for the Butterworth filter, and a 0.1-dB attenuation cutoff frequency of 1.87 MHz for the Chebychev filter.
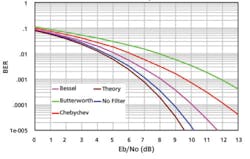
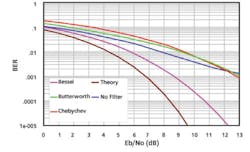
Figure 2 shows the resulting BER for lossless filters. The Bessel filter performs significantly better than the Butterworth filter. For lossless filters and a signal-to-noise power (Eb/No) ratio of 11 dB, the Chebychev filter has 11 times more errors than the Bessel filter.
Figure 2. BER of Lossless Filters, No Amplifier, No Interferer
Practical Filters
The seventh-order low-pass filters used in this simulation require seven resonators when they are implemented as RF filters for a mobile radio system. Since the 1,920- to 1,980-MHz frequency band is used for the WCDMA-UMTS uplink, the normalized filter bandwidth is 3.84/1,950 = 0.2%. From filter tables,4 the unloaded Q (Q0) value required for a filter with a 0.2% RF bandwidth and 1-dB insertion loss is approximately 12,000 for the Bessel filter, 23,000 for the Butterworth filter, and 58,000 for the Chebychev filter.
For dielectric resonators, Q0values from 10,000 to 40,000 (20,000 typical) can be obtained.5 A Q0 of 10,000 results in an insertion loss of 1.2 dB for the seven-resonator Bessel,4 2.5 dB for the Butterworth, and 7.6 dB for the Chebychev filter.
In a WCDMA base station, the RF filter is placed immediately after the antenna. As a result, a 7.6-dB insertion loss due to a Chebychev filter results in a noise figure of 7.6 dB and causes its curve in Figure 2 to shift 7.6 dB to the right to keep a consistent Eb/No ratio.
A 7.6-dB noise figure is too large for a practical mobile radio system. For a Q0of 20,000 and a 0.2% RF bandwidth, the normalized unloaded Q (q0) is 43, resulting in an insertion loss of 0.6 dB for the Bessel filter, 1.2 dB for the Butterworth filter, and 3.2 dB for the Chebychev filter.
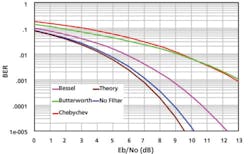
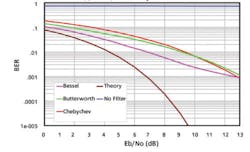
Figure 3 shows results similar to those of Figure 2 but for practical filters with a Q0 of 20,000. The Butterworth and Chebychev filters have nearly the same performance, and the Bessel filter has 62 times less errors at an Eb/No of 11 dB.
Figure 3. BER of Filters (Q0 = 20,000), No Amplifier, No Interferer
Adjacent Channel Interference
To investigate adjacent channel interference, an interferer with 20 dB more power than the input signal and a carrier frequency 5 MHz above the input signal was used. This corresponds to an adjacent radio channel. To investigate the effect of the interchannel interference, an ideal RF amplifier was used.
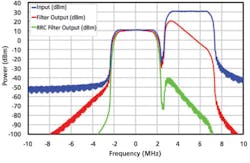
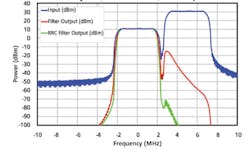
Figures 4 and 5 show the spectral results of a Bessel and a Chebychev filter in the receiver chain. The blue curves are the input spectrum before the filter. The red curves depict the spectra after the filters. The green curves show the spectra after this signal is passed through the RRC filters in the receiver. The Chebychev filter removes much more of the adjacent channel interference than the Bessel filter. Also, the RRC filters are very effective at removing any adjacent channel interference.
The resulting BER plots, using practical filters with a Q0 of 20000, ideal amplifiers, and an adjacent channel interferer 20 dB above the desired signal, are indistinguishable from Figure 3. The plots show that high levels of adjacent channel interference do not affect the BER performance, provided the RF amplifier does not cause any distortion.
Figure 5. Spectra for Chebychev Filter With Adjacent Channel Interference Chebychev, 20-dB Interference, Ideal Amp
Amplifier Distortion
In practice, the RF filters are mounted as close to the base station antenna as possible, and an amplifier is used after the filters to amplify the signals prior to further frequency shifting and demodulation. These amplifiers must exhibit a very good noise performance and produce sufficiently low distortion levels so the BER is not affected.
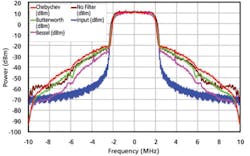
The effect of amplifier distortion on a WCDMA signal was investigated using a typical amplifier6,7 with an input 1-dB compression level (IP1dB) of +3 dB, being 3 dB above the input signal power of 0 dB. The amplifier’s third-order intercept point (I3IP) of +19 dB is 16 dB above the IP1dB level, as shown in Figure 1.
The amplifier gain was set to 0 dB to allow the amplifier to be switched in and out of the signal path without affecting other parameters. The amplifier has a noise figure of 3 dB, which is typical of low-noise amplifiers.6,7 Most manufacturers do not give the second-order IM intercept point (2IP) since this normally produces signals outside the frequency band of interest. Consequently, the 2IP was not considered in this simulation, and the default settings were used. These amplifier specifications were used to obtain the results shown in Figure 6.
Figure 6. Spectra After Amplifiers
To demonstrate the effect of amplifier distortion on BER, a typical amplifier was included in the configuration used to obtain Figure 3. The resulting BER plots are virtually identical, indicating that when there is no adjacent channel interference, an amplifier with an IP1dB of 3 dB above the input signal and an I3IP of 19 dB above the input signal will not effect the resulting BER noticeably.
Effect of Amplifier Distortion on Adjacent Channel Interference
To further investigate the effect of amplifier distortion, an interferer with 20 dB more power than the input signal was used with a practical amplifier. An amplifier with an input 1-dB compression level (IP1dB) of 23 dB (Pmax = 23 dB), being 3 dB above the power of the adjacent channel interference, and a third-order intercept point (I3IP) of +39 dB, being +16 dB above the IP1dB level, was used.
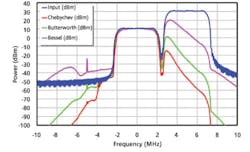
The spectra at the amplifier output of the receivers using Bessel, Butterworth, and Chebychev filters are shown in Figure 7. Since the Chebychev filter removed more of the unwanted adjacent channel interference, its amplifier had more headroom than the amplifier associated with the Bessel filter.
As a result, the least unwanted signals are generated by the Chebychev filter and amplifier while the most unwanted signals are caused by the Bessel filter and amplifier combination. For all filters, the IP1dB level is at least 3 dB above the largest signal so little compression will take place. Comparing Figures 6 and 7 shows that a large interferer causes more out-of-band amplifier distortion as expected.
Figure 8depicts the corresponding BER. Comparing Figures 3 and 8 shows a negligible difference in the results for the Bessel, Butterworth, and Chebychev filters. The Bessel filter again gave a much lower BER than the Butterworth or Chebychev filters. The performance without any filter is now poor, demonstrating that RF filters are required in a practical WCDMA base station.
To further investigate the effect of the amplifier distortion, the ratio between the I3IP and IP1dB was kept the same at 16 dB, but the I3IP level was reduced from +23 dB to +14 dB (Pmax = 14 dB) and now is 6 dB below the adjacent channel power. This corresponds to a typical amplifier being subjected to an excessive level of adjacent channel interference.
Figure 9shows the corresponding BER plot. The BER of the Bessel filter is only a little better than that of the Butterworth and Chebychev filters for low Eb/No ratios and worse for high Eb/No. These results are for amplifiers that are grossly overloaded, with a 1-dB compression level 6 dB below the input power level.
These results also show the importance of amplifier performance and the need for the amplifier to have a 1-dB compression level significantly above the largest possible adjacent channel interference. The importance of RF filters again is highlighted since the BER without filters is very poor. Under those conditions, Bessel RF filters give a significantly better performance.
Conclusion
The simulation results show that under practical operating conditions Bessel filters provide a significantly lower BER and a lower insertion loss than the Chebychev filters currently used in WCDMA mobile radio base sta-
tions. The group delay is more important than the amplitude response for WCDMA signals, and a combination of Bessel RF filters and highly linear input amplifiers will result in the best base station performance.
Acknowledgement
The author acknowledges his employer, James Cook University, and in particular the staff of the School of Engineering for their support and encouragement. The author thanks AWR for making its software available to universities. Without this software, these computer simulations would not have been possible.
References
- Jacob, M.V., Mazierska, J., and Knack, A., “Superconducting Narrow Passband Filter for Mobile Communication,” Transactions of the Materials Research Society of Japan, MRS-J Vol. 29, No. 4, 2004, pp. 1273-1277.
- Saari V., Ryynanen, J., Mustola, J., Halonen, K., and Jussila, J., “A 10 MHz Channel Select Filter for a Multicarrier WCDMA Base-Station,” IEEE International Symposium on Circuits and Systems, 2006.
- AWR Corp., Microwave Office and Visual System Simulator, http://web.awrcorp.com/
- Zverev, A.I., Handbook of Filter Synthesis, 1967.
- Knack A, “Design and Implementation of HTS Technology for Cellular Base Stations: An Investigation Into Improving Cellular Communication,” James Cook University, 2006.
- Minicircuits, Amplifier Selection Guide, http://www.minicircuits.com/products/amplifiers_monolithic.html
- RF MicroDevices Amplifiers <1-W Devices; http://www.rfmd.com/ then select amplifiers
About the Author
Cornelis Jan Kikkert is an associate professor of electrical and computer engineering in the School of Engineering and Physical Sciences at James Cook University and a senior member of IEEE. He has more than 20 years of experience in the design of RF electronics for communications equipment, broadcast transmitters, satellite beacon receivers, and weather satellite receivers and has held positions at Marconi Instruments, GEC Avionics, and Rohde & Schwarz. Dr. Kikkert is the author of more than 80 papers and a book on RF electronics and the inventor on eight patents. James Cook University, Building DD14; Room 111, Townsville, QLD 4811 Australia, e-mail: [email protected]
April 2010
