Millimeter Wave Spectrum Analysis With Hand-Held Instruments
For decades, if you wanted to make a millimeter wave spectrum analyzer measurement, you were forced to use large, heavy bench test equipment because there were no other options available.
To make field measurements, you had to bring a generator and extension cords to operate the equipment or an inverter to power the instruments from a vehicle’s battery and run the risk of draining the battery or wasting a lot of gasoline.
Today’s field engineers need to measure millimeter wave backhaul transmitters as well as conduct thorough measurements of 3G or 4G cellular base stations. On occasion, they also will have to hunt for interfering signals. A hand-held instrument that can address all these scenarios while replacing multiple bench-sized instruments is the solution they seek.
Studies have shown that network reliability plays a significant role in subscriber churn as customers point to dropped calls, poor coverage, and network outages as reasons they switch carriers. Findings such as these make it more critical than ever for network operators to meet optimization goals for key performance indicators (KPIs) including availability, quality, and coverage.
A new generation of hand-held spectrum analyzers addresses the complex wireless landscape. These instruments test and verify the quality of RF, modulation, and downlink coverage of base stations’ transmitters to improve KPIs associated with call drop rates, call block rates, and call denial rates.
Millimeter Wave Backhaul Measurements
One key capability now required is to conduct millimeter wave measurements. The roll-out of 38-GHz backhaul links has led to the need for equipment to measure the power, bandwidth, and frequency of the link signal.
Since the power of a digitally modulated signal isn’t confined to a narrow frequency range, it is necessary to measure channel power rather than power at a single frequency to accurately assess the total power output. This is easily done if the hand-held spectrum analyzer has a built-in channel power measurement since it determines the integrated power across the modulation bandwidth.
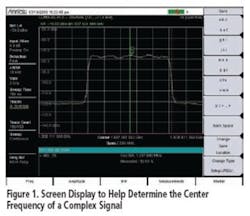
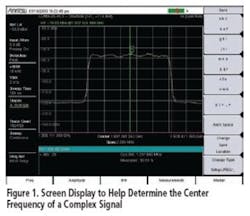
For a broadband signal, determining the frequency is a bit of a challenge since there generally isn’t a carrier frequency that can be measured. An alternative is to measure the occupied bandwidth.
Cell Site Measurements
Many hand-held analyzers now can be equipped with a complete suite of 3G and 4G measurements, such as LTE, CDMA, EV-DO, GSM/EDGE, W-CDMA, and WiMAX. The expanded capabilities allow engineers to make detailed measurements of a base station to assure that it is meeting its KPIs such as average burst power for a GSM or EDGE signal.
Average burst power is one critical RF measurement that needs to be performed in the field. High or low burst power values will generate larger areas of cell-to-cell interference as well as lower data rates near cell edges. Additionally, low values will create dropouts and dead zones. Conducting these spectrum analysis tests will help locate the cause of the problem to reduce and possibly eliminate signal transmission issues.
The goal of measurements such as average burst power, error vector magnitude (EVM), and carrier-to-interference (C/I) is to increase data rate and capacity by achieving accurate power settings, ensuring low out-of-channel emissions, and maintaining good signal quality. These attributes help lower dropped call and blocked call rates and provide a satisfying customer experience.
These measurements are used when commissioning a cell site to ensure that the site meets contractual specifications. Many of these same measurements also are needed when a site is being audited to make sure its performance hasn’t drifted out of specification. When the site is commissioned, measurements are made and archived so they can be compared to measurements made later. Measurements saved and transferred into a computer can be compared to current measurements to detect performance drift or degradation.
Interference Measurements
Interference is an ever-growing problem. The number of transmitters on the air increases each day—some licensed, some unlicensed, some legal, and some illegal.
Once an interferer has been discovered, the next step is to use direction finding and triangulation to locate the transmitter. In the past, the interference hunter had to rely on paper maps for this purpose. Now, you can use a map in the measuring instrument to plot the location of an arriving signal. By making multiple measurements at different locations and plotting them on the map, you can quickly find the cause of interference.
The location of the instrument is determined by its GPS coordinates, and you move the knob to place a line on the map based on the orientation of the receiving antenna. Software makes it easy to capture a map from Google Maps and size it to fit the instrument’s screen. The area covered is easily adjustable to meet your interference-hunting needs.
Ideally, the area in the map would be large enough to cover the probable locations of the interfering signal. Saving several versions of the map at varying degrees of magnification covering different portions of the expected area can make finding the exact location of the transmitter easier once you get close to the interferer.
Over-the-Air Measurements
Remote radio heads (RRHs) now are an important subsystem of base stations. An RRH contains the base station’s RF circuitry plus analog-to-digital/digital-to-analog converters and up/down converters. RRHs have operation and management processing capabilities and a standardized optical interface to connect to the rest of the base station—all of which are particularly important when technologies such as WiMAX and LTE are deployed. They also simplify MIMO operation, improve base station efficiency, and facilitate physical location for gap coverage problems.
For all these reasons, conducting accurate, efficient tests on RRHs is paramount. Over-the-air (OTA) measurements are a new feature that allows technicians to spot-check coverage and signal quality to ensure RRH performance without taking the cell site off-line. Sync signal power and frequency error are among the measurements that can be made OTA.
Sync signal power measurements allow technicians to measure for uneven amplitude of subcarriers. Data collected on weak subcarriers will be less reliable, creating a lower overall data rate. Sync signal scanners can be used in conjunction with a built-in GPS to save scan results for display on a map at a later date. Once sync signals are mapped, it is easier to understand and troubleshoot interference or coverage issues.
Built-in GPS capability also is advantageous when conducting frequency error measurements. Carrier frequency error OTA measurements can be accurately measured with a GPS-enabled instrument. This capability and an instrument’s compact size allow technicians to drive while measuring the signal to ensure mobile device handoffs can be made at higher speeds.
Hidden Signals
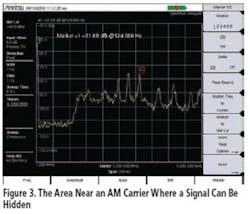
Commercial applications are but one area in which the improved frequency coverage and overall performance of hand-held spectrum analyzers are beneficial. Hand-held spectrum analyzers can be configured with a 140-MHz IF output that is 30 MHz wide. Spectrum coverage of this nature is suitable for signal-monitoring agencies since they often have their own proprietary signal processing tools.
Conclusion
The influx of more complex signals in an ever-crowding spectrum has changed the requirements of field test instrumentation. The proliferation of millimeter wave backhaul to accommodate next-generation technologies designed to meet customer demand for increased bandwidth and upload/download speed also has changed the wireless test landscape.
Hand-held spectrum analysis tools with the frequency range and capabilities that previously were only found in bigger, heavier instruments now are available. The combination of wide frequency coverage, performance, and compact size has created a new generation of hand-held instruments that can help ensure the efficient operation of next-generation wireless networks.
About the Author
Steve Thomas is a senior product manager at Anritsu Company. Mr. Thomas has more than 30 years of experience in the RF and microwave instrumentation arena, including work in noise figure measurement and vector network analysis. He is the author of numerous technical articles on interference and has made multiple presentations on the subject. e-mail: [email protected]


