The U.S. Department of Energy’s Pacific Northwest National Laboratory has issued its annual report on distributed wind capacity, revealing that large installations of distributed wind power almost doubled in 2017.
Distributed wind power is localized, so the power is generated near where it will be used rather than originating in remote commercial wind farms and getting sent to load centers over long transmission lines. Distributed wind farms generate power for homes, farms, businesses, and other locations where the power is typically consumed onsite, or on the local distribution system to meet energy demands. Facilities can range from a 5-kW turbine powering a home to a few multi-megawatt turbines sending electricity to several industrial sites on the same distribution system.
In 2017, the trend toward larger turbines in distributed installations continued. The number of installed turbines that generate 100 kW or more nearly doubled compared with 2016. These installations represent a $262 million investment in 2017, according to the report.
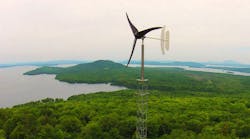
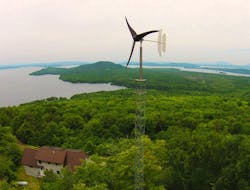
This 1.7-kW Pika Energy T701 wind turbine is located at a home in Maine. (Credit: Pieter Huebner/Off-Grid Enterprises)
There are more than 81,000 wind turbines used in distributed applications across the U.S. and its territories, totaling more than 1,000 MW of distributed wind capacity.
“Although smaller turbines still account for the most units sold, this is the third year in a row that the installed capacity of larger installations has risen,” says Alice Orrell, who led the PNNL study. Whether used by factories, commercial businesses, or even utilities, this wind power production offsets pressure on local electrical grids, and the market seems to appreciate this benefit.”
The report found that 78% of the installed distributed wind capacity documented for 2017 serves utility loads on local distribution grids.
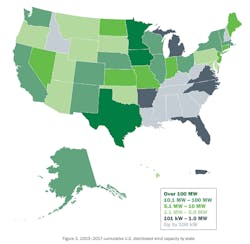
The report also tracks distributed wind power state-by-state. Twenty-one states added a total of 83.7 MW of new distributed wind capacity in 2017, representing 3,311 wind turbines totaling $274 million in investment. Iowa ranked first in distributed wind capacity installed in 2017 with 63.5 MW and, now with a total of 192.7 MW, leads the nation in cumulative distributed wind capacity.
Here is the U.S. distributed wind capacity, by state, for 2003 through 2017.
“In general, it was a good year for distributed wind power,” says PNNL’s Nik Foster, who was part of the research team. “While exports of U.S.-made wind turbines decreased from 10.3 MW in 2016 to 5.5 MW in 2017, investments in the U.S. rose by $111 million, the number of installed units grew by 28%, and another turbine was certified, showing confidence in the technology.”
Now in its sixth year, the Distributed Wind Market Report was funded by DOE’s Wind Energy Technologies Office to help the distributed wind community—utilities, manufacturers, and federal and state agencies—keep an eye on current market conditions and regulatory environments. It provides the wind power community with a year-to-year comparison to measure growth and trends, as well as data such as costs, number of deployments, performance and capacity factors, types of turbines used, customer type, domestic and international markets, and market drivers and barriers.


