Magnetic-Core Modeling Offers Insight into Behavior, Operating Range, Saturation
This file type includes high resolution graphics and schematics when applicable.
It's often necessary to understand the behavior of magnetic components during operation, primarily when applied to chokes or inductors being used for magnetic energy storage and subsequent release. Since most of these components use the magnetic properties of their cores, it’s difficult to build an efficient and reliable electronic device without knowing how the magnetic materials behave in the field created by the inductor's winding.
Any magnetic core may saturate, and since the saturation border is not sharp, a first step is to agree on a saturation point. Some devices can afford a higher level of the core saturation, others have a very low one, and some devices use saturation. An analytical tool for assessing the core saturation mode will therefore save considerable design time.
This analysis uses an analytical expression that models the B-H curve diagram by closely describing the process of magnetic-core saturation. It’s based on general principles of a magnetic core's behavior in magnetizing and de-magnetizing processes, but cannot take into account all specificities of magnetic materials being used in the electronics industry.
Efforts to find a function that could closely represent a B-H curve resulted in Equation 1. This part of analysis is intended to model the behavior of materials having negligible coercive force, such as soft ferrites:
where B(Hx) is the function that simulates the B-H magnetization curve; Bsat is the magnetic material saturation flux density; Hx is the current value of the magnetic field strength, and H0 is a reference magnetic field strength, which is still to be found. It defines the slope of the magnetizing curve.
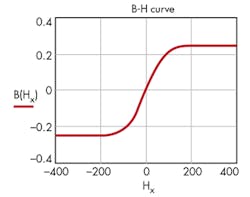
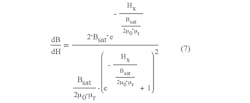
In the corresponding B-H curve (Fig. 1), the slope of the B-H magnetic curve (which is the full magnetic permeability of the material), is found by differentiating Eq. 1 over Hx. The slope clearly reveals the value for H0:
Designating the derivative as:
and defining the slope of the B-H curve at H = 0, we can obtain the missing value for H0:
At the same time, we have:
Therefore, using Eq. 4, we get:
As a result:
However:
therefore:
Using this in Eq. 1, we have:
Unfortunately, this formula is barely usable, as designers are primarily interested in the dependence of the inductance on the magnetizing current. Instead, move from the classical B-H curve, which we will also plot later to the required L(I) function. Since:
where L is the inductance; Smag is the magnetic core cross-sectional area; lmag is the core's central magnetic line length; and Nt is the inductor's number of turns.
The first fraction is the parameter:
where AL is the inductance factor:
Therefore:
The value for AL can be found in the magnetic-core datasheet. The second fraction is the slope:
Simplifying, we obtain:
Therefore:
By Ampere's Law, we have:
where Im is the magnetizing current, Using this in Eq. 8, we find:
This expression describes the dependence of inductance on the magnetizing current. Simplifying it yields:
Equation 10 allows us to find the magnetizing current and the value at which saturation begins:
Some examples and figures show how these equations can be put to use.
Example 1: Basic B-H curve
Using mT := 0.001T; nH := 10-9H; µr := 2500; and Bsat := 0.25T, plus the equation:
produces the B-H curve of Figure 1.
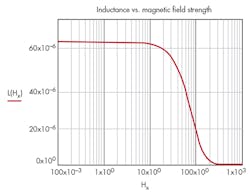
Example 2: Inductance vs. magnetic-field strength
Assuming AL := 4204 nH and Nt := 4, and:
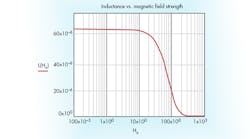
yields the inductance versus magnetic field strength of Figure 2.
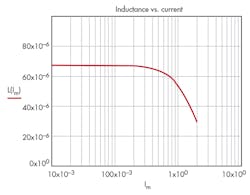
Example 3: Inductance versus current
Assume Imag := 0.103 m, and
The plot in Figure 3 shows inductor behavior in the magnetic field in terms of the field strength and applied current. It’s reasonable to set up the borderline for saturation at –3 dB of the maximum value of the core permeability or inductance.
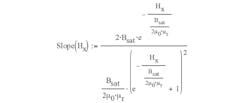
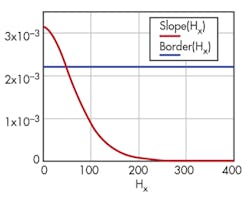
Example 4: Permeability is equal to the slope of the B-H curve
The expression:
defines the position of the borderline at –3 dB (Fig. 4):
And, Border(Hx) := Border.
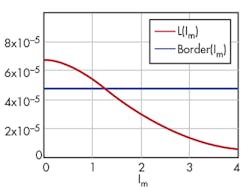
Example 5: Core saturation plot
For inductance, the borderline that defines core saturation is shown in Figure 5, using µr := 2500; lmag := 103 mm; S := 138 mm2; Nt := 4; Bsat := 0.25T; L1 := Nt2 • AL1 = 6.735x 10⁻⁵H; Border(Im) := BorderL; and:
and
and
Solving with respect to the saturation current, we obtain:
and Isat = 1.241A.
In conclusion, this modeling method makes it possible to estimate a magnetic core's operating range and helps avoid unwanted behavior.
