Modeling on Mondays: The GAP/R K2-W—Its Model, Measurements, and Suggestions for Further Work (Part 6)
What you’ll learn:
- How chassis and flywire techniques are used to prototype tube circuits.
- SPICE models can be tuned to individual devices under test.
- Nakabayashi’s model may be more accurate than the Koren model for positive grid currents.
For all but the simplest of devices and systems, modeling can become a significant and ongoing effort in the quest to make the model more and more accurate. But we should also remember that one of the principal purposes of a model is to foster insight into what’s being modeled.
Throughout this six-part series,1-5 we have worked toward creating and evaluating a basic SPICE model for the Philbrick (GAP/R) K2-W, the first commercially available operational amplifier. That vacuum-tube-based op amp enjoyed a long production lifetime: It was popular, inexpensive, and adequate for a wide variety of analog-computing tasks.
Our most-recent effort5 was that of evaluating the K2-W SPICE model set forth in Reference 4. We compared its performance according to simulations done in SPICE with the expected performance stated in the manufacturer’s data bulletin for the K2-W. Agreement was, in general, excellent.
The purpose of this article is threefold:
- Describe briefly the elements of a bench setup suitable for making a few basic measurements on a physical K2-W to add to the verification of the model
- Report the results of the measurements made
- List a few suggestions regarding possible improvements and extensions to the model, possible analyses of the K2-W’s innards, and fun activities with actual K2-Ws.
The Bench Setup
The previous article reported values included in the manufacturer’s specifications associated with the K2-W, along with the results, obtained via LTspice, of simulated measurements applied to our model of the K2-W. Agreement between the two sets of values was very good, providing confidence in the fidelity of the model with respect to the quantities of interest. However, for any model, possible extensions likely could be useful, but they would require access to, and measurements on, the actual device or system as the model undergoes further development.
At the same time, “measurements” done via a simulator such as SPICE can oftentimes become an important means of verifying not only the model of the unit under test (UUT), but also the setup used in making the physical measurements. Thus, it’s always advisable, whenever possible, to make measurements at the bench. There’s always something to be learned there.
The following equipment was used as part of the bench setup:
- Variable, regulated dc power supply capable of providing 300 V at its output. Two were needed to provide the ±300-V supply voltages required by the K2-W. (Specific equipment used: Kepco KR4 M Voltage Regulated Power Supply)
- Variable, regulated dc supply for the approximate 1.5-V input bias for the K2-W. (Specific equipment used: Heath 2718 Tri-Power Supply)
- Function generator to act as a signal source. (HP 33120A Function / Arbitrary Waveform Generator)
- Oscilloscope. (Siglent SDS 1202X-E Digital Storage Oscilloscope)
- Voltmeter. (Agilent U1272A True-RMS Multimeter)
- Audio analyzer. (PrismSound dScope Series III)
- Gain-phase meter. (HP 3575A Gain-Phase Meter)
- Laptop computer to interface, as required, with the oscilloscope and the audio analyzer.
- Breadboard fabricated to accommodate the K2-W and required attendant circuitry for the desired tests and measurements.
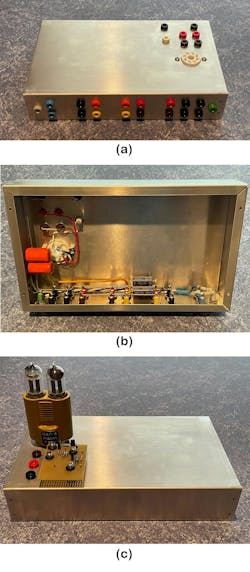
The breadboard (or “measurement platform”), shown in Figure 1a, comprises a 10- × 6- × 2-in. aluminum chassis and a plugboard.
Available on the top surface of the chassis are an octal socket to accommodate the UUT (the K2-W) and seven banana jacks (two for connecting to the inverting input of the K2-W, two for the noninverting input of the K2-W, one for the K2-W’s output, and two for signal ground).
The rear of the chassis contains 18 banana jacks for connection to the high-voltage supplies and the heater supply; for measurement of +VPP and ‒VKK (at the UUT); for measurement of the power-supply currents; and for connection to safety ground. The underchassis (Fig. 1b) contains wiring among the various connectors, as well as two RC networks comprising the sense resistors used for measuring HV-supply currents and shunt capacitors to hold the supply pins for the UUT at dc ground.
The size of the chassis is ample, allowing for future inclusion of multiple additional K2-Ws, custom VT-based op amps, or other circuitry.
The plugboard’s substrate is a 0.062-in. pad-per-hole FR-4 circuit board with four banana plugs mounted such that the board can be plugged into the chassis. There are connections to the K2-W’s inverting and noninverting inputs and output, and to signal ground. Attendant circuitry for all of the measurement setups shown in Reference 5, along with jumper blocks to select among those measurement setups, and to insert or remove an output-load resistor, is included on the plugboard. Several attachment and test points are in the mix to accommodate external connections, scope probes, etc.
The intent in using the chassis-plus-plugboard combination is to keep the test-and-measurement setup as organized as reasonable (Fig. 1c) to minimize, as practicable, the effects of parasitics, and to ease switching among various measurement setups.
Measurement Results
What follows is a brief summary of the results obtained from measurements made at the bench. At first, it seemed important to follow up the “measurements” made via SPICE on the K2-W model with measurements made at the bench on a physical K2-W. (However, a more important outcome of the bench measurements can be the knowledge and experience gained when the results of the bench measurements vary from the values stated in the manufacturer’s specifications for the K2-W. Resolution of gross differences will always, it is hoped, result in improved measurement setups.)
A single K2-W was used as the UUT. Both of its 12AX7 VTs had GAP/R labels, inferring that the VTs had been hand-selected as high-gain (high-μ). Measurement of the values of all resistors, except one, internal to the K2-W can be made from the external pins. Allen-Bradley carbon-composition resistors were used by GAP/R, and all such resistors have values that tend to drift over time. Resistance measurements confirmed that all resistors of the UUT had remained within tolerance.
For each of what appears below, the value given in the manufacturer’s specifications is provided first. The result of the corresponding bench measurement follows. (Please refer to Reference 5 for the values obtained from the simulated measurements made on the model.) A given measurement setup corresponds generally to the respective setup used in the simulations in Reference 5. Additional comments on a given measurement are included when deemed useful.
Input Bias
- Specification: Positive input should be made to operate about 1.5 V high at balance, normally requiring adjustable external bias. The version of the data bulletin used in Reference 5 states, “Adjustable from 0.9 to 1.7 volts between Pin 1 and 2 (Pin 1 positive with respect to Pin 2).” (Pease recalled that the K2-W’s input offset voltage was ‒1.5 V [design center] ±0.25 V typical, ±0.5 V maximum.11)
- Measurement: For the UUT, Vin+ = 1.41 V produced vo = 0.0047 V ≈ 0.
- Comments: The UUT was run open-loop, with the inverting input grounded. Connection of a 47-kΩ load had negligible effect.
Gain
- Specification: 15,000 dc, open loop. (Pease stated that a voltage gain of 20,000 was typical, with 10,000 the minimum, for a ±50-V output swing into a 50-kΩ load.11)
- Measurement: 60,000 at 2 Hz, open loop.
- Comments:
- The function generator and the gain-phase meter were used for the measurements, which were made over the frequency range 2 Hz through 100 kHz. The oscilloscope was used for spot checks under appropriate conditions (i.e., at sufficiently high frequencies and signal amplitudes to be useful).
- The measurement setup was of the same topology as that in Fig. 1 of Reference 5, but with different resistor values as follows: R1 = 12 kΩ; R2 = 22 kΩ; R3 = 8.2 kΩ; and R4 = 2.2 kΩ. No input-offset compensation was used for the measurements (i.e., the noninverting input of the UUT was held at signal ground). The effective output load was 1 MΩ (the input resistance of the attached gain-phase meter).
- The measurements indicated the dominant pole to be at approximately 50 Hz, with the gain initially falling off at a rate of greater than 20 dB/decade past the dominant pole, then decreasing at 20 dB/decade between 1 kHz and 100 kHz, the upper frequency limit for the measurement sequence. Gain was approximately 4.6 dB at 100 kHz.
- As mentioned previously in Reference 5, benchtop measurements of open-loop gain are fussy in several regards. Noise can be a huge problem, especially when measuring the voltage at the summing junction. The particular measurement configuration used, and the values of the components in that setup, can have a significant effect on the values obtained for the gain. Several assumptions are made when employing a simple setup such as the one used herein. Designing and implementing a measurement setup that provides good accuracy with small measurement uncertainty can become an arduous task. Fortunately, for our present purposes, being off by as much as several dB isn’t a critical issue.
Output Impedance
- Specification: Less than 1 kΩ open loop; below 1 Ω fully fed back.
- Measurement: Measured at 1 Hz, Zout = 0.17 Ω.
- Comments: The measurement setup was as shown in Fig. 3 of Reference 5. The audio analyzer was used to obtain readings of the UUT’s output voltage vo and the voltage across R_L.
Voltage Range
- Specification: ‒50 Vdc to +50 Vdc at output and both inputs
- Measurement: 54 V with a 47-kΩ resistive load attached.
- Comment: The measurement setup had the UUT connected as an inverting amplifier, with R_i = 10 kΩ and R_f = 100 kΩ.
Output Current
- Specification: ‒1 mA to +1 mA, driving a 50-kΩ load over full voltage range.
- Measurement: Not needed.
- Comment: The results of the voltage-range measurement made with a 47-kΩ resistive load attached confirms that the K2-W meets this specification.
Power Requirements
- Specification: 4.5 mA at +300 Vdc; 4.5 mA at –300 Vdc.
- Measurement: 3.57 mA at +299.8 Vdc; 3.47 mA at ‒299.7 Vdc.
- Comment: The measurement was made after a 15-minute warmup, with the UUT at quiescence in a G = ‒ 1 inverting-amplifier configuration.
Response
- Specification: 2-μs rise time, with bandwidth over 100 kHz when used as an inverter.
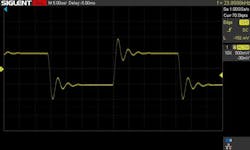
- Measurement: 1.6-μs rise time (0 to peak), with 47% overshoot; 1.6 μs fall time (Fig. 2, below).
- Comments:
- The function generator and the gain-phase meter were used to measure the magnitude response of the UUT. Input signal level was 1 Vrms. The output load R_load was 44.9 kΩ. No input-offset compensation was used for the measurements (i.e., the noninverting input of the UUT was held at signal ground).
- The measured magnitude response in the stated configuration was similar in character to that shown in Fig. 3 of Reference 4 for the model. It was essentially flat at 0 dB below about 50 kHz, then climbing gradually to +0.5 dB at 100 kHz, peaking at roughly +6.6 dB at about 280 kHz, and dropping to ‒3 dB at about 440 kHz.
- For a given gain, both the frequency response and the step response of the circuit depend on the values of R_b and, to some extent, R_load.
Thoughts for Follow-up Activities
For those sufficiently interested to have made it this far in this series of articles, the following is a brief list of activities to choose from in the quest of additional exposure to, experience in, frustration surrounding, and fun resulting from spending additional time related to VTs, VT-based op amps, and related analog circuits:
- Add heaters to the model―either the model of the 12AX7 or the model of the overall K2-W.
- Make the 12AX7 parameters (μ, etc.) functions of heater voltage.
- Make a high-μ model of the 12AX7. If the Koren6 or other nonlinear model is used, doing so will require adjustment of other parameters used in the 12AX7 model. Measurements will probably be required.
- Use an improved 12AX7 model that better describes operation under positive grid current. Koren’s is admittedly very approximate. Nakabayashi’s model7 might be a good one to consider.
- Regarding the external bias circuitry, observe and explain why a non-zero internal resistance of the input-offset-null voltage has an effect on the frequency response and step response of an inverting amplifier.
- Model the voltage coefficient of resistance associated with the Allen-Bradley resistors used in the K2-W. (See the correspondence in Reference 8.)
- Build your own test-and-measurement setup for the K2-W. Make any laboratory measurements you might be interested in.
- Build your own K2-W, but with precision metal-film resistors, and with Zener diodes in place of the NE-2 neon lamps.
- Make dc-voltage measurements at various points within the K2-W model via SPICE and within an actual K2-W on the bench. (WARNING: Some K2-Ws are radioactive.9 According to Reference 10, radiation measurements made on more than 50 modules indicated that, for the modules measured, all K2-W and K2-X modules having either beige or black housings produced Geiger-counter readings; all gray K2-W, K2-X, and K2-XA modules produced no effect.)
- Measure common-mode rejection ratio (CMRR), both on the model and on an actual K2-W. Compare your findings with the estimate given by Pease.11
- Measure power-supply rejection ratio (PSRR), both on the model and on an actual K2-W. Compare your findings with the estimate given by Pease.12
- Read the Philbrick applications manual.13 Build and observe the operation of some of the simple standard configurations, such as the inverter, the integrator, etc.
- Obtain a bunch of K2-Ws. Buy, borrow, or build two 300-Vdc power supplies. Then build a small analog computer.
- Create a K2-W model using a small-signal gm equivalent circuit for the 12AX7s. Evaluate the model’s performance and compare it with Philbrick’s published specifications for the K2-W.
- Modify the design of the K2-W by making the differential pair symmetric. Using SPICE, evaluate the performance of the modified K2-W.
- Design a VT-based constant-current source (actually, sink) to replace the tail resistor in the K2-W’s differential pair. Using SPICE, evaluate the performance of the modified K2-W. Compare especially the PSRR and the CMRR of the modified K2-W with those of the unmodified K2-W.
- Analyze the second stage (the common-cathode gain stage) of the K2-W, both with and without the positive-feedback loop connected. Using SPICE, evaluate the performance of the K2-W (open-loop gain, frequency response, etc.) without the positive-feedback loop, and compare with the performance obtained with the positive-feedback loop connected.
- Develop a compact model for the K2-W. Begin with a simple one-pole model that includes input impedance, output impedance, finite dc open-loop gain, input bias current, and input offset voltage. Using SPICE, compare the performance of your compact model with that of the model developed in Reference 4.
References
1. Stephen A. Dyer, “Modeling on Mondays: SPICE Modeling of Common Active Devices—An Overview (Part 1),” Electronic Design.
2. Stephen A. Dyer, “Modeling on Mondays: An Intro to Simulation of Vacuum-Tube Triodes in SPICE (Part 2),” Electronic Design.
3. Stephen A. Dyer, “Modeling on Mondays: Nonlinear SPICE Models of Vacuum-Tube Triodes (Part 3),” Electronic Design.
4. Stephen A. Dyer, “Modeling on Mondays: The GAP/R K2-W Vacuum-Tube Op Amp in SPICE (Part 4),” Electronic Design.
5. Stephen A. Dyer, “Modeling on Mondays: GAP/R K2-W Vacuum-Tube Op Amp SPICE Modeled Performance (Part 5),” Electronic Design.
6. Norman L. Koren, “Improved vacuum tube models for SPICE simulations. Part 1: Models and example,” updated Mar. 20, 2003.
7. Ayumi Nakabayashi, “Ayumi’s Lab.: Audio.”
8. www.philbrickarchive.org/sk2-v_hand_traced_schematic.htm.
9. www.philbrickarchive.org/sk2-v_radio-active_neon_bulb.htm.
10. www.philbrickarchive.org/sk2-v_radium_paint_on_neons.htm.
11. Robert A. Pease, “What’s All This K2-W Stuff Anyhow?,” Electronic Design, Jan. 5, 2003.
12. Robert A. Pease, “What’s All This K2-W Stuff Anyhow? (Part 2),” Electronic Design, Feb. 2, 2003.
13. George A. Philbrick Researches, “Applications Manual for PHILBRICK OCTAL PLUG-IN Computing Amplifiers.”


