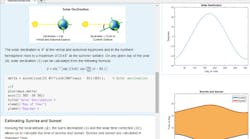
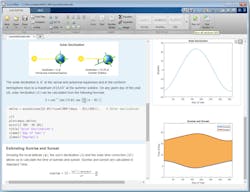
The Mathworks’ MATLAB R2016a brings many new features to embedded developers and programmers, including a new development environment called Live Editor (Fig. 1). Live Editor is more interactive than the conventional MATLAB IDE that is still part of the mix. Live Editor differs in the way comments and online documentation are incorporated, as well as how results are presented as it targets those who prefer a more experimental/interactive environment and those learning MATLAB for the first time.
Graphs and tables are often the output from a MATLAB script and the conventional IDE can pop up a window containing the results, but Live Editor places this information in the right part of the window right next to the script code. Changes can then be made by editing the code and the results can be viewed immediately.
The interactive nature of Live Editor is a definite plus, but I think a more significant aspect is the merging of documentation with script code. Live Editor uses the same script code, but allows document blocks to be dropped in anywhere through the code. These blocks can contain formatted text and graphics such as possible results that were copied from previous script execution.
This approach allows the documentation and code to be combined into a single document instead of multiple documents. It also puts it into a single creation environment. Developers can easily include examples, results, and links to the internet in a form that is easy to view and use versus the more clunky, text-only alternative of script comments.
Live Editor allows teachers and instructors to create a story that includes descriptions and images along with the code. In many ways, it looks like an interactive book for highlighting code and mathematical equations. The documentation cannot contain executable code, but it can link other interactive sites.
The system is integrated with the latest symbolic math support in MATLAB. There are also new functions for plotting mathematical expressions and equations that work with any MATLAB scripts.
Application Design Tools
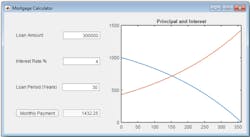
The App Designer tool provides a way to create applications with a graphical front end (Fig. 2). The graphical layout support uses familiar fields for forms as well as graphical charts, graphs, and controls like buttons and sliders.
The layout tool generates the code to create the forms. Some of the code can be edited to link it to the rest of a MATLAB application, but some code is shown in read-only form since it is based on the layout. It can be changed by modifying the graphical layout.
Menus and forms provide a way to link graphical entities to application code. The App Designer tool provides an easy way to move between graphical layout and testing and editing of application code.
The App Designer, Live Editor, and the main IDE get to take advantage of the new graphics subsystem that was first introduced in R2014b. This included new default colormaps and line colors for better presentation as well as anti-aliased fonts and lines. R2015b provides more customized plot configuration while the latest version adds polar plots, multiple y-axis plots, and the math and equation plotting already mentioned.
Another developer tool is the new Add-On Explorer. This provides a way to search the online database of contributed code and support and then download and install it quickly and easily. This includes community-authored toolboxes, models, functions, and applications.
MATLAB Performance
MATLAB R2016a will also bring a major performance boost to new and existing MATLAB applications. The execution engine now JIT compiles all MATLAB code. It was more selective in the past and interpreted the remaining code. The average performance improvement is on the order of 40%. Of course, your mileage may vary.
The latest compiler reduces function-call overhead and improves the performance of many object-oriented features such as method dispatching. There is also improvement in some element-wise operations that are common in array operations used by MATLAB applications.
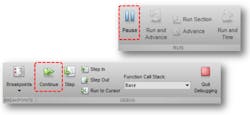
One last item worth mentioning is the Pause button (Fig. 3). It is used to stop a running MATLAB script and presents the debugger, allowing a programmer to examine the current state and adjust the debugging environment in doing things like adjusting breakpoints. In the past, predefined breakpoints were the only way stop a program short of terminating it.
MATLAB already contains a host of programmatic and mathematical features, but the latest crop of interactive and design tools will make use of these features faster and easier.
Looking for parts? Go to SourceESB.


