Researchers in a variety of scientific and engineering disciplines increasingly need to characterize multiple attributes of high-speed events. Traditionally, they would have relied on measurements gathered by data acquisition (DAQ) hardware coupled with analog sensors—strain gauges, thermocouples, accelerometers, potentiometers, and more. Nowadays, high-speed video cameras have become the tool of choice for much of this speed-dependent research.
Especially in recent years, high-speed video strongly complements and heightens traditional characterization systems used for analyzing fast events. For example, biomedical researchers can gain new insight into bone fracture mechanics by combining high-speed video with accelerometers and strain gauges attached to the bone specimens. Aerospace engineers can better quantify the speed of flows over an airfoil by combining hot-wire anemometer data with detailed images of particles in the flow.
Despite the scientific insights made possible by the simultaneous measurement of video and analog sensor signals, it has not always been easy to harmonize these methods. The post-processing expertise and time required to chronologically synchronize the analog sensing and video data have erected a significant barrier to research organizations. Making the problem worse, separate engineering teams typically operate the high-speed camera and sensor-based DAQ system, and the “camera team” and “data team” tend to use different analysis methods and workflows.
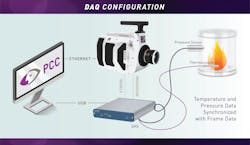
To overcome this problem and provide a unified data acquisition solution, Vision Research has implemented a direct link between its Phantom high-speed cameras and off-the-shelf DAQ units from National Instruments. This link allows researchers to collect analog data and video data simultaneously, unifying formerly distinct data acquisition workflows. Often referred to as data fusion, the link also lets researchers visualize the synchronized video and analog data side by side within Vision Research’s Phantom Camera Control (PCC) software application.
Keeping in Sync
When combining high-speed imaging with DAQ methods, users set up these two systems of measurement as they normally would. The camera and lighting are placed to capture high-quality images of the event of interest. The DAQ system digitizes the same event using analog data from the relevant sensing devices. PCC software seamlessly synchronizes the images and analog data in real time.
The physical connection between the camera, DAQ hardware and computer running PCC software consists of standard high-speed Ethernet and USB connections, making it fast and easy to “wire up” the system. In essence, PCC serves as the back-end for both the images and DAQ data, allowing users to display the images alongside the analog sensor data—and step through the video frame by frame while seeing changes in the sensor data. PCC also allows users to export the data in CSV format for further analysis.
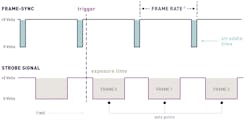
The DAQ and imaging systems sync via two transistor-to-transistor (TTL) signals from the camera—recording and strobe signal. The DAQ processes these signals and places them in the center of each frame. With a simple software setting, users can utilize the full sampling frequency of the DAQ system in applications that demand it.
Once an event is captured and stored in the camera’s RAM, the video playback with embedded DAQ signal data is ready to be viewed immediately within PCC. Cine Raw files will automatically be saved with the synchronized analog sensor data for future analysis and output.
Advantages of High-Speed Imaging
When used with traditional sensing techniques and a DAQ system, high-speed imaging adds value in three major ways:
Workflow efficiency. Incorporating the DAQ system with the camera drastically improves workflow by decreasing the number of steps necessary to synchronize the two data streams. One team can perform the work, rather than two or more.
Data in one place. Traditionally, all data has been spread between teams of people. Now, it is all conveniently stored in the Cine file.
Seeing is understanding. Finally and the most valuable, adding visual representation to the more abstract picture created by sensor data can lead to new insights. In a vibration analysis, for instance, researchers can now easily see an object’s displacement while analyzing vibration frequencies using conventional spectral analysis methods like Fast Fourier Transform (FFT).
Case Studies
The following five case studies illustrate some of the applications for high-speed cameras, DAQ hardware and PCC software—including the ways high-speed imaging provides additional insights into the processes at hand.
In the first example, a pickle switch triggers a Phantom camera via a simple switch closure. The camera’s trigger port is typically maintained between 4 and 5 volts. Triggering the pickle switch closes the switch—causing the signal to drop and triggering the camera. Pushing the button causes the signal to drop from 5 to 0 volts, while releasing the button returns the signal to 5 volts. The ability to visualize the trigger with the frame data is valuable for users who need to see the trigger position relative to the event. It is also good practice to use this setup to ensure the camera and DAQ system are functioning properly.
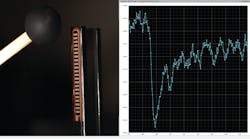
In general, scientists undergo rigorous calibration steps prior to employing strain gauges in an experimental system. Doing so enables them to correlate the measured voltages with the applied force or strain. In this second example, a strain gauge was attached to a tuning fork using strong, fast-acting adhesives. The leads of the strain gauge ran to the signal conditioning circuit, which consisted of a wheatstone bridge, whose arms have resistance values roughly equivalent to that of the strain gauge.
By monitoring the digital signal coming from the strain gauge, users can immediately see the strain gauge resonating at its natural frequency. They can also use the strain gauge to visualize any impact to the tuning fork system—including deflection and vibration. Interestingly, users can use the high-speed camera to validate the strain gauge measurements. Images can be post-processed to plot a position versus time graph, which coincides directly with the data collected by the DAQ. By taking FFTs from both the strain gauge and image data, users can determine the vibrational modes present during the event.
Most high-speed camera systems include a BNC-port interface to carry available I/O signals, including the f-sync, strobe, ready and recording signals. To see one or more of these signals relative to the captured video, users can simply connect the signals in the back of the camera to the DAQ unit. This third example allows users to visualize the strobe signal—a square wave that determines both the frequency and degree of exposure time—with respect to the light source.
This method is quite useful, as it is traditionally difficult to synchronize strobe lights with high-speed video. By seeing the strobe signal relative to the light signal, users can easily shift—i.e., delay—the strobe signal or light pulse in a way that optimizes the amount of light. Visualizing the strobe in the software also lets users see where it exists relative to other trigger signals present in the system. Lastly, collecting such data allows users to compute the standard deviation—or other statistics—in the strobe signal pulse.
An Image-based auto trigger (IBAT) automatically triggers a Phantom camera when motion is detected. This feature is particularly impressive, as its minimum trigger time is within one frame. At a frame rate of 1 million frames per second (fps), for example, IBAT can trigger the camera within 1 microsecond of detected motion. This feat would be otherwise impossible to achieve without the use of a field programmable gate array, or FPGA—a massive parallel logic gate that can process images in near real-time.
IBAT is useful for characterizing continuous processes like cells passing through microchannels at very high speeds. A user may only want to trigger the camera when the cells pass through the field of view (FOV), for example. By feeding the IBAT-out signal from the camera into the DAQ, a user can easily see when a target’s motion satisfies the user-defined IBAT image criteria (it causes the IBAT-out signal to go from high to low).
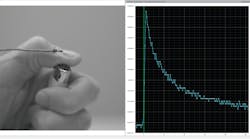
Flames and explosions are another area of interest for many researchers. In addition to visualizing the flame profile, researchers may want to know the temperature of the flame with respect to space and time. An excellent way to obtain this information is to synchronize high-speed video with the analog data coming from a thermocouple. In this final example, a household lighter rapidly heats a type K thermocouple—enabling users to easily correlate the image’s visual thermodynamics with the measured temperature profile. Analyzing the data reveals a rapid rise in temperature, followed by a classic cooling curve.
Conclusion
The value proposition of a combined high-speed imaging and DAQ system may seem obvious to any researcher studying fast moving objects or events. In practice, however, bringing these two systems of measurement together has not been easy given the differences between imaging and DAQ workflows. By creating a link between high-speed cameras, off-the-shelf DAQ hardware and PCC software, researchers now have a unified tool to see what they have been measuring—ultimately providing more insight into the subject at hand.


