“Why Didn’t I Think of That?”—Seeing Inside Embedded Systems
Download this article in PDF format.
Embedded software developers are quite familiar with using a code editor, a compiler, linker, debugger, and, of course, an evaluation board. Most of the time, these tools are all you need to develop and debug an embedded system. But what do you do when you want to verify the operation of dynamic systems like motor control, process control, chemical processes, flight systems, and more?
Modern processors have specialized debugging hardware that allows tools to display or change memory locations while the target is running. Let’s explore how such debugging hardware can be used to help you visualize the state of your embedded system with little or no CPU intervention, and while the target is running.
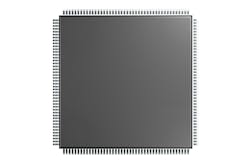
If you’ve been designing embedded systems for a while, you know how complex devices have become and how hard they are to debug. Microcontroller units (MCUs), self-contained devices (black boxes) with on-chip memory, are packed with literally hundreds or even thousands of registers that are used to control the operation of various peripheral devices (Fig. 1).
1. How do you see inside a “black box” device like a microcontroller?
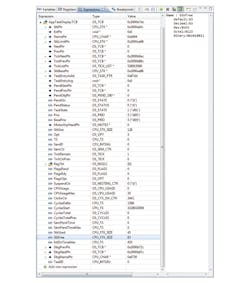
Every toolchain comes with a debugger, which, at a minimum, allows you to stop the target and examine variables and I/O registers (in the watch window) (Fig. 2). Although quite useful when debugging algorithms have no real-time component, this capability is somewhat useless when you can’t afford to stop the target, e.g., motor control, process control, etc.
2. A debugger enables the developer to stop the target and examine variables and registers in a watch window.
To monitor the proper operation of a running embedded system, developers typically revert to a number of techniques that require code to be added to the system being monitored:
LEDs
Developers of embedded systems typically have access to at least one LED they can use to indicate that something is working; when the light turns green, the CPU made it to main() or some other place of interest. LEDs are great at indicating go/no-go status. However, if you want to verify the status of additional operations, you’ll need either more LEDs, or you’ll have to be creative with the ones you have, e.g., blip patterns, blink rates, etc.
7-Segment Displays
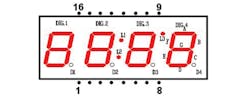
Low-cost embedded systems might be equipped with either LED or LCD 7-segment displays for use by the end user (Fig. 3). The embedded developer can borrow the display during development to provide an indication of what’s happening in the embedded system.
3. Low-cost embedded systems are often equipped with LED or LCD 7-segment displays for development.
A 7-segment display can display numeric values in binary, decimal, hexadecimal, or even limited alphanumeric values. You’re typically limited to the range of values you can display based on the number of digits available. Also, if you want to display different values, then you’ll need a way to cycle through them. If your embedded design doesn’t require a display, then you might add a display just for testing purposes. Of course, for this to work, you’ll need to write code for this purpose.
Character Modules
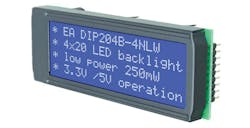
Character modules (LEDs or LCDs) are fairly low-cost devices that you can use as a debugging tool (Fig. 4). Modules are available that interface through either a parallel port (requires 6 to 10 output lines) or through a serial interface (typically UART). Character modules are available in a 1 × 8 (1 line by 8 columns) configuration all the way to 4 × 40. These displays are easy to use and allow you to display alphanumerical characters.
4. Developers can use low-cost LED- or LCD-based character modules as a debugging tool.
As with the 7-segment display technique, you’ll have to write code to format and position the variables of interest, and program a way to select different values if the selected display doesn’t have enough characters for your needs. Character modules have the added benefit of being able to display bar graphs. A chapter in Embedded Systems Building Blocks (see Bibliography) provides a longer explanation of character modules.
printf()
The printf() function is, in my opinion, one of the most overused and problematic tools you can turn to. Whenever you want to display the occurrence of an event or display the value of variables, you have to format a string, rebuild your code, download it, and restart your application. The printf() outputs are generally sent to a debugger text console, an RS-232C port, or USB. Values “fly off” the screen once you reach the number of rows you can display, which oftentimes is more annoying than useful. Not only does printf() require a fair amount of code, it negatively affects the timing of your system.
Graphical Display
If your end product contains a graphical display, then you can use it during debug to display large amounts of data and even graphs. However, the debug code would eventually need to be thrown away or hidden in the released version of your code. A graphics library requires tens to hundreds of kilobytes of code space and a lot of RAM (depends on the display resolution), consumes CPU cycles, and adds complexity to your application. There are better choices.
The above options are inadequate if you’re trying to display a large amount of data or, worse yet, you forgot to include some critical value that needs to be displayed for a process-control application. You then have to edit/compile/download and run a new build, and bring your application in the “state” you are trying to observe. Also, displaying data is fine, but what do you do if you also need to change the value of variables such as setpoints, limits, gains, offsets, etc.?
Graphical Live Watch
Advanced processor cores like the ARM Cortex-M or Renesas RX are equipped with a hardware debugger port that provides direct access to memory and peripherals without requiring any CPU intervention. In other words, memory and I/O locations can be displayed, or changed, at run-time without having to write a single line of target code.
The tool, called µC/Probe, uses the debugger port found on Cortex-M or RX MCUs. It allows you to display or change the value of variables or I/O port registers while the target is running. You’re able to display values by assigning them to graphical objects such as gauges, numeric indicators, LEDs, thermometers, etc. You also can change the value of variables by assigning those variables to sliders, switches, numeric inputs, and more. In addition, µC/Probe can interface to the target via RS-232C, TCP/IP, or USB, but this requires a small target resident monitor. A Segger J-Link is by far the most convenient and least intrusive option.
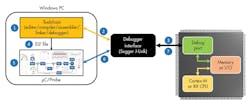
5. Using the µC/Probe tool, developers can debug embedded designs through a Graphical Live Watch window.
Figure 5 shows how µC/Probe works:
1. Write code using any editor, compile it, and link it.
2. Connect the debugger to the target debug port through, in this case, a Segger J-Link.
3. Download code to the target MCU either into flash or RAM. Then, instruct the debugger to run the code to start testing.
4. µC/Probe reads the executable and linkable format file generated by the compiler and extracts the name of the variables, their data types, and physical memory locations (i.e., their address). Then it creates a symbol table that’s used to assign variables to a graphical objects library built into µC/Probe.
5. Drag and drop graphical objects (gauges, LEDs, sliders, etc.) and assign them to variables from the symbol table. µC/Probe also knows about the names and addresses of I/O ports through chip definition files (CDFs) that are built into it. This allows the user to look at raw analog-to-digital converter (ADC) counts, update digital-to-analog converters (DACs), look up or change the value of GPIO ports, and so on.
6. Once variables or I/O ports are assigned to graphical objects, press the µC/Probe “RUN” button and the tool will start requesting (as fast as the interface allows it) the current value of those variables and I/O ports through the J-Link interface. J-Link converts those requests into either the memory reads or writes that occur concurrently while the CPU is executing the target application.
To monitor the value of additional variables, simply stop µC/Probe, add the graphical objects, assign them to the desired variables, press RUN, and the tool displays—or allows you to change—those variables. There’s no need to stop the target, nor edit application code, compile, download, and restart.
The µC/Probe in Action
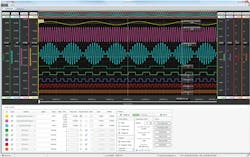
Let’s explore an example use of µC/Probe. How can one observe the intermediate values of a proportional-integral-derivative (PID) loop where the update rate of the loop occurs at 1 kHz? As shown in Figure 6, µC/Probe has a built-in 8-channel digital storage oscilloscope.
6. The µC/Probe features a built-in 8-channel digital storage oscilloscope.
Once more, there’s no need to stop the target. If the variable is available in the symbol browser, it can easily be assigned to one of the channels. It’s able to trigger on the positive or negative slope of any channel, delay trigger, do pre- or post-triggering, zoom in and out, and more. Without µC/Probe, a developer would have to scale and output the variables to available DAC ports (assuming there are some) to observe those signals. This would be highly intrusive, and you might have to rebuild your application each time you want to look at different traces.
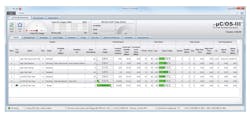
The embedded target can run bare-metal code or work in conjunction with a real-time operating system (RTOS) kernel. µC/Probe has built-in kernel awareness for popular RTOSs, and of course, as is the case with other variables, that information is displayed live (Fig. 7). The status of each task is displayed in a row and contains its name, task priority, CPU usage, run counter, maximum interrupt disable time, maximum scheduler lock time and—by far the most valuable piece of information from this view—the stack usage for each task.
7. The µC/Probe has built-in awareness of popular real-time operating system kernels.
Specifically, when designing RTOS-based embedded systems, one of the most difficult aspects is establishing the stack space needed for each task (see the blog “Detecting Stack Overflows” here and here for more detail). µC/Probe displays the maximum stack usage for each task using a bar graph, which provides a very quick visual indication of how close or far the stack is from overflowing. The built-in kernel awareness feature of µC/Probe also allows developers to monitor the state of other kernel objects, such as semaphores, mutexes, queues, timers, etc.
Summary
Testing and debugging real-time embedded software can be challenging. In fact, it’s surprising that more tools aren’t available to simplify embedded product design. Any tool that offers instant visibility into the inner workings of your application is worth looking into.
The forethought of chip designers to provide versatile debug interfaces as those found on modern processors such as the ARM Cortex-M and Renesas RX processors makes it easier for tools to peek inside running embedded systems without interfering with the CPU. Data-visualization tools like µC/Probe let developers see inside an embedded system to effortlessly confirm the proper operation of the design, or reveal anomalies you can identify and fix, leading many to ask, “Why didn’t I think of that?”
Bibliography
Labrosse, Jean J., Embedded Systems Building Blocks, Complete and Ready-to-Use Modules in C, ISBN 0-87930-604-1, CMP Books, 2000.
Labrosse, Jean J., "Detecting Stack Overflows (Part 1 of 2)," March 8, 2016.
Labrosse, Jean J., "Detecting Stack Overflows (Part 2 of 2)," March 14, 2016.

