Hadoop and other tools have put “Big Data” on the map along with massive storage and compute clusters in the cloud. These have allowed users to manipulate and mine very large datasets with information that’s often been collected via the Internet or by the growing array of sensor networks used in multiple industries.
This file type includes high resolution graphics and schematics when applicable.
I recently talked with Paul Pilotte, technical marketing manager for MathWorks, about these issues and the Big Data analytics tools from MathWorks that support the increasing size of datasets in a wide variety of industries, from oil and gas to automotive and aerospace.
Wong: What Big Data shifts are you seeing taking place among engineering companies?
Pilotte: More and more companies are finding that if they can access data from lots of different sources while using more sophisticated predictive analytics tools like machine learning, they can make better and more accurate decisions. We’re finding this to be true across nearly all of the engineering disciplines, whether on the medical device side or in aeronautics.
In the automotive sector, for example, companies are taking fleet data from passenger and off-highway vehicles. They’re capturing field data from hybrid electric vehicles so that their engineers can build models to optimize fuel efficiency. For large off-highway vehicles (think loaders, trucks, and dozers used in mining operations), they’re capturing field data to ensure that they can meet service-level agreements and improve design reliability to maximize uptime. This is indicative of a trend where companies are accessing data from a number of different sources and building complex models to better understand how a design works in the real world. Then they use this to improve designs and optimize operational performance that directly impacts their bottom line.
Wong: Why is this happening now?
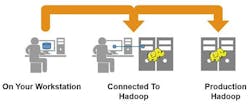
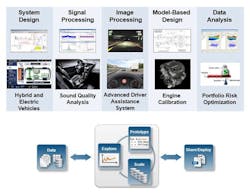
Pilotte: For years, we found companies really loved the ability to analyze data on their workstations, develop models, visualize those models, and then share them with others. Nearly all of those companies, for the past several years, have been asking, “Okay, can I work with data that’s slightly larger than what will fit in the workstation’s memory?” What we’ve introduced in MATLAB Release R2014b is the ability for those users to access what I’d call “uncomfortably large” data, which is data that doesn’t fit into the available system memory. With MATLAB MapReduce, users can explore and analyze big data sets on their workstations with the MapReduce programming technique that’s fundamental to Hadoop. They can create applications based upon MATLAB MapReduce to work with their “uncomfortably large” data on workstations, and deploy these same applications within production instances of Hadoop, using MATLAB Compiler (Fig. 1).
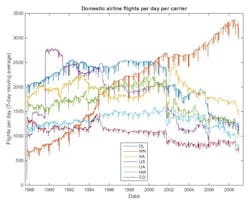
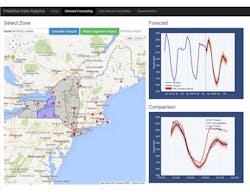
This is important since the majority of companies within the science and engineering space don’t have production Hadoop systems today, but many are considering these in the near future. By using MATLAB MapReduce today, companies can begin learning to use and build programs and become familiar with how easy it is to take models and integrate them into their IT systems (Fig. 2). Across the board, we are seeing many companies taking the next steps to access more of their data to build more sophisticated analytics.
Wong: What challenges are you helping your customers address?
Pilotte: A large medical-device company we work with has a number of researchers who earned their neuroscience PhDs using MATLAB. They wanted to bring in data from a lot of medical instruments and build neuroscience models using very large datasets.
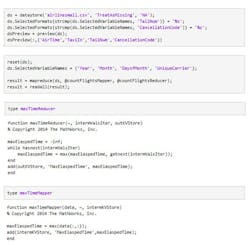
A year ago, those researchers had to be very familiar with Hadoop—in effect they had to be experts in Java programming in addition to neuroscience. We found this to be a typical scenario, and what we’ve made possible with MATLAB is the ability for a non-Java programmer to easily develop and run their analytics applications on Big Data (Fig. 3).
We’re also seeing this need arise more and more in the engineering space. Rather than hire a data scientist who may have the technical skills but not the domain expertise, companies want their existing domain experts to be able to do this work. They’re asking us to lower the bar by making it easy for these domain experts to ingest and preprocess data and apply machine-learning techniques without being a mathematician. Therefore, it also needs to be easy for that domain expert to develop predictive models, test for accuracy and interoperability, and provide an easy hand-off to IT to operationalize their analytics to gain business insights and impact.
Providing a convenient data-analytics workflow to these domain experts solves the tool issue. We also provide additional support that helps users quickly move up the data-analytics learning curve. From training to seminars to our MATLAB Central user community site, there’s technical support available for domain experts.
Wong: What does the data-analytics roadmap look like moving forward?
Pilotte: Due to the rapid increase in available data, companies are seeing their data-analytics needs move beyond their design engineering departments to some of their other organizations, such as quality assurance and operations, where they are integrating data-analytics models into new systems or services.
This gives us the opportunity to help users access data from many disparate sources and from newer NoSQL databases. A lot of this is being driven by the Internet of Things (IoT) and new data access standards, and many of the challenges are inherent in serving the needs of a particular industry or application. For example, within the geo-sciences space, the MATLAB user community over the years has created lots of toolboxes, programs, and scripts for their own custom formats and analyses. We have a large community of end users who have built their own data-processing tools within MATLAB and made them available for the community to use and extend.
The other issue simply is about making it easy to use visualization tools—being able to very easily plot data, use apps to look at different features, and see which ones will be most important in your work. It’s really about incorporating intuitive and interactive visualization as a key part of the data “exploration” and modeling steps.
Wong: What companies will benefit the most from data analytics moving forward?
Pilotte: Historically, we’ve seen that the financial services industry is among the leaders, and has been using our tools for credit modeling, risk modeling, algorithmic trading, and so on.
At the 2014 Strata+Hadoop World conference, there was exciting activity happening around the Industrial Internet or Industrial Internet of Things (IIoT). Unlike the consumer Internet of Things, IIoT includes devices designed for harsh environments, built to last for decades, and often located in industrial settings such as an automotive factory floor or within the energy grid (Fig. 4).
This is a group that will really benefit from data analytics, and includes many design engineering fields such as automotive, aerospace, industrial automation, and process control. There’s a lot of exciting activity happening around IIoT, which is going to interconnect more and more devices and allow more data to be available for gaining new insights quickly.
This file type includes high resolution graphics and schematics when applicable.
Data analytics opens up a whole new universe for users in this area. Within the software and Internet industries, we will see a lot of other manufacturing and machine-based companies, as well as industrial-automation, equipment-control, and process-control companies benefit from the ability to bring data in, explore it, build models, and then integrate those models using a common modeling workflow.
