Let your digital receiver measure its own noise figure
Modern digital receiver/exciters (DREX) used in radar and communications systems are capable of significant self-testing in a production factory environment. Long past are the days where the analog portions of the system existed as line replaceable units (LRUs) separate from the digital. Greater levels of mixed-signal integration and size reduction have created production environments where the optimal solution is to use the built-in spectrum analyzer of the DUT itself.
To such an end, a simple technique was developed to allow a DREX to measure its own noise figure (DREX-SM) using the traditional Y-factor methodology of a hot-source/cold-source comparison.
Concept
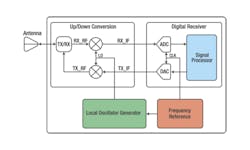
Figure 1 shows a notional block diagram of a radar receiver/exciter. Notice that the LRU contains frequency references, local oscillator generation, up/down frequency conversion, and digital-to-analog (D/A) and analog-to-digital (A/D) as well as signal processing functions.
In a production environment, testing of this LRU must be performed as a complete assembly with access only to the external interface(s). The integrity of the product is violated if the LRU is opened to allow measurement of noise figure. To make this measurement, it is desirable to use the inherent functions of the digital receiver.
The most common method used for measuring noise figure is the Y-factor approach. A known hot and cold temperature noise source is applied to the input of the DUT, and the noise results at the output are compared to determine noise temperature of the DUT itself.
Overview of the Y-factor method for measuring noise figure
The Y-factor method generally is a two-step procedure: the first step is for calibration, and the second is for the actual measurement of the DUT. The equipment needed includes a calibrated noise source and a power detector, such as a spectrum analyzer or power meter. The noise source is specified by its excess noise ratio (ENR) which is the ratio of the difference in hot and cold noise temperatures to a reference of 290K. Expressed in dB:
The Y-factor (Y) is found by measuring the noise power at the output of the system with the noise source as the input to the system. Specifically, the Y-factor is the ratio of the output noise power with the noise source in the ON state (NON) to the power when the noise source is in the OFF state (NOFF).
The noise figure (dB) can be calculated from the ENRdB and the Y-factor by
DREX-SM variation of the Y-factor technique
The Y-factor calibration step is required to account for the noise figure of the power detector (for example, spectrum analyzer). For the technique presented here, the calibration step is not required since the spectrum analyzer in this case is part of the DUT. With this, the technique is simplified to making two measurements: one for NON and another for NOFF. From these measurements, the noise figure then can be computed directly from equation 6.
The Y-factor shown in equation 5 and equation 6 is a linear term and requires that the values of NON and NOFF be in units of actual power. For convenience, most measurements taken by the digital receiver typically would be expressed in terms of decibels (dB or dBm). Because of this, the following equation is used to find the Y-factor:
For example, if using a source with an ENR of 6 dB and the measured values for NON and NOFF are -20 dB and -22 dB, using equation 7, Y can be found as follows:
NFdB = 6dB – 10log10 (1.585 – 1) =8.3dB
To validate this technique, noise figure measurements were made using the Y-factor method with a spectrum analyzer as discussed in reference 1. This method actually measures the noise figure of the analog chain only, from RF input to just before the ADC of the receiver.
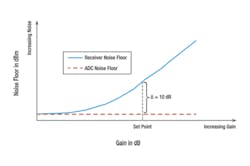
In most cases, the noise figure of a receiver will be primarily due to the analog chain, with little contribution from the ADC. For this to hold true, the noise floor of the ADC must be adequately below the noise floor of the analog chain. The noise floor of the ADC is a fixed dBm level. It is additive not multiplicative noise and therefore is not specified as a noise figure. In measurements, it can be thought of as a noise figure for a fixed condition of analog gain and a noise figure in front of the ADC. As a rule of thumb, the gain in the analog chain usually is set to keep its noise floor at least 10 dB above that of the ADC, as shown in Figure 2.
Results of the DREX-SM method
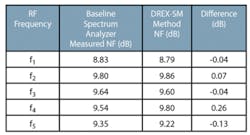
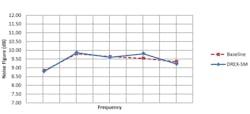
For a baseline, receiver noise figure was first measured with a noise source and a spectrum analyzer as discussed in reference 1. These measurements were through the analog up/down conversion chain as identified in Figure 1. So that a comparison of the results would be meaningful, the gain of the analog chain was set high enough that the contribution from the ADC noise floor of the DREX would be negligible. Baseline and DREX-SM method results are given in Table 1 and Figure 3. Frequencies f1 through f5 are equally spaced frequencies within the system’s operating frequency band.
Considering the DREX ADC noise floor contribution
For verifying the DREX-SM method, the gain of the analog chain was set at its highest level. This allowed the noise figure of only the analog chain to be the quantity for comparison. However, as the gain of the analog chain is reduced, the noise floor contribution from the ADC increases and must be considered in overall system design. Because of this, there is a trade-off between dynamic range and noise figure of the DREX when planning the gain of the analog chain. It should be noted that there is a potential pitfall in assuming that the noise figure of a DREX is simply equal to the noise figure of the analog chain.
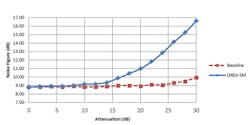
Noise figure measurements were made with both the DREX-SM and the baseline Y-factor method while varying the gain of the analog chain. The gain adjustments were made with digital RF attenuators near the back end of the analog chain. Overall, the baseline-method noise figure measurements remained relatively constant while the DREX-SM method shows the noise figure increasing with higher attenuation. Results can be seen in Figure 4, demonstrating that the ADC noise floor contribution to noise figure becomes significant with increasing receiver attenuation (decreasing analog gain).
With a reasonably high-gain analog chain, an increase in attenuation should result in a decrease in gain (gain measurements verified this but are not shown here), with very little effect to noise figure. It can be seen in Figure 4 that the DREX-SM and the baseline methods each show little change in noise figure for attenuation up to about 8 dB. For higher attenuations, the DREX-SM noise figure results increase. For an attenuator setting of higher than about 15 dB, in this case, the actual noise figure of the DREX is significantly different than that of the analog chain only. The increase seen in the baseline noise figure from 25 dB to 30 dB of attenuation most likely can be attributed to the contribution of the attenuator itself.
Conclusion
A variation of the Y-factor method, using a DREX to self-test noise figure, has been proven to be a practical option for highly integrated systems. It can be argued that measuring noise figure using the internal spectrum analyzer of the DUT yields a more representative value of system noise figure because it includes any passive loss between the analog chain and the ADC, and more importantly, the ADC’s effective noise figure contributions. This method can be used for design verification and production acceptance testing of highly integrated DREX systems.
Reference
1. Leffel, M. and Daniel, R., The Y Factor Technique for Noise Figure Measurements, Rohde & Schwarz, Application Note.
Additional reading
1. Fundamentals of RF and Microwave Noise Figure Measurements, Keysight Technologies, Application Note 57-1.
2. Noise Figure Measurement Accuracy – The Y-Factor Method, Keysight Technologies, Application Note 57-2.
About the authors
Thomas T. Leise is an Engineering Fellow with Raytheon’s Space and Airborne Systems Division. He has 30 years of experience in radar, EW, antenna, and receiver/exciter systems.
Andrew L. Silveira is a senior electrical engineer with Raytheon’s Integrated Defense Systems Division. He has worked for Raytheon for more than 12 years, primarily on RF design and integration.
Jeremy T. Perkins is an electrical engineer with Raytheon’s Integrated Defense Systems Division. He has been with the company for two years, working on a radar program. Prior to joining Raytheon, Perkins was an assistant professor of electronics at Southside Virginia Community College.
