This file type includes high resolution graphics and schematics when applicable.
When designing filters, engineers very often need to know what the filtered value at the output will be. This is especially important for variable switching power supplies operating at different duty cycles. The analysis presented here discusses the calculation of the filtered output for RC filters, which are common in feedback circuits, current transformers, output devices, and other circuits. However, the analysis easily can be extended to other kinds of filters.
Related Articles
- Rediscover The Truly Tunable Hall Network
- Simple Circuit Turns PWM Into A Digitally Adjustable Precision Reference
- Spice Simulator Tunes RC Active-Filter Circuits
It’s well known that for rectangular-pulse inputs the rms values of the unfiltered output parameters, like voltage and current, are proportional to the square root of a duty cycle. But the designer of a feedback filter for a switching power supply must consider that the filter output is not an rms value but rather proportional to the pulse’s duty cycle. You can adjust the filter’s parameters to obtain an rms value, but it would be valid only for one duty-cycle value.
The analysis employs several assumptions:
• The filter works in a continuous-conduction mode, which means the filter’s time constant is much greater than the pulse’s repetition rate (period).
• The filter capacitor’s charge and discharge time constants are the same. That means the impedance sourcing signal to the filter is much lower than the filter resistance and the filter’s load impedance is much higher than the filter’s resistance, which you can easily obtain by using an operational amplifier as a decoupling component.
• The filter’s voltage grows in exponential steps (charging and discharging) that become smaller as the output voltage approaches its limit value.
• The filter is loaded with an impedance that is so high that it can be ignored.
We did the analysis with MathCAD 15, and anyone with the appropriate license can reproduce the results.
The expressions for the nth values of the filtered voltage’s maximum, Vh, and minimum, Vlow, are:
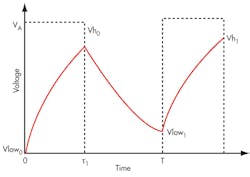
where τ is the filter’s time constant and τ1 is the pulse duration (Fig. 1).
For simplicity, define:
τ1 = DT (6)
where D is the duty cycle of the input pulse train;
τ = kT (7)
where k is the number of periods for the filter time constant. So Equations 1 and 2 become:
Vhn = VAβ +Vlownγ (8)
Vlown = Vh(n–1)α (9)
To derive the equation for the limit value of the filter output, you must use the recurrent equations for the low and high values and calculate the average, which is based on the initial parameters only. The equations for six high/low pairs are:
Vh0 = VAβ
Vlow0 = 0
Vh1 = VAβ(γα + 1)
Vlow1 = VAβα
Vh2 = VAβ(γ2α2 + γα + 1)
Vlow2 = VAβα(γα + 1)
Vh3 = VAβ(γ3α3 + γ2α2 + γα + 1)
Vlow3 = VAβα(γ2α2 + γα + 1)
Vh4 = VAβ(γ4α4 + γ3α3 + γ2α2 + γα + 1)
Vlow4 = VAβα(γ3α3 + γ2α2 + γα + 1)
Vh5 = VAβ(γ5α5 + γ4α4 + γ3α3 + γ2α2 + γα + 1)
Vlow5 = VAβα(γ4α4 + γ3α3 + γ2α2 + γα + 1)
Note from the above equations that:
and:
The average for the output voltage is:
You can calculate the limit for the normalized output voltage using MathCAD tools:
or:
(See the derivation of Equations 13 and 14 in “Normalized Output Voltage Limit Derivation,” below.)
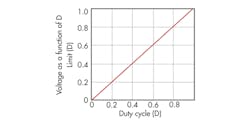
Equation 14 is a transcendent equation with two variables, which is hard to solve symbolically. But you can find the limit value graphically by fixing the value of k and plotting the limit as a function of the duty cycle, D. If k = 100.0:
A plot of this function shows that the limit of the normalized RC filter output is the duty cycle, D (Fig. 2).
To create an example, assign values to the variables in Figure 1:
VA = 1 V
D = 0.6
T = 20 µs
τ1 = DT
k = 50
τ = kT
Then:
α = e–(T – τ1)/τ = 0.992
β = 1 – e–τ1/τ = 0.012
τ = e–τ1/τ = 0.988
Then:
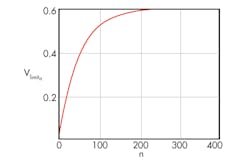
To plot the graph for the limit, assign n = 1…400. Then:
Figure 3 shows the resulting plot.
Gregory Mirsky is a principal electrical engineer at Atlas Materials Testing Company. He holds an MS from the St. Petersburg Baltic Technical University, Russia, and a PhD from the Moscow State Pedagogical University.
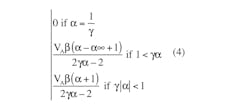
NORMALIZED OUTPUT VOLTAGE LIMIT DERIVATION
Equation 12 can be interpreted as:
Its solution is:
Only the lower expression is of interest:
Its solution is:
Again, only the lower expression is of interest:
which can be converted into Equation 13.


