Testing Implantable Medical Devices
Minimal analog access ports make testing today's complex digital implantable medical devices a unique challenge.
Electronic test of medical devices shares some obvious challenges with testing for military applications. FDA and ISO 13485 test requirements aren t the same as military standards, but a highly regulated environment creates a certain overhead of process and documentation. Beyond that, extremely thorough tests are necessary for life-critical applications.
Customers expect perfect products even though the features added to every new model multiply the complexity of the electronics inside. It's the job of the test engineer to create and implement a test strategy that will deliver perfect products in spite of manufacturing or material variations. As a result, it's not surprising that the last thing to touch an implantable device such as a pacemaker or an implantable cardioverter defibrillator (ICD) is a tester.
Successful test strategies for these devices cover components, subassemblies, and the final devices. The ICs and subassemblies of an implantable medical device yield to test techniques similar to those used in other areas of high-reliability electronics. The finished device, generically termed a pulse generator (PG) by the industry, provides unique testing challenges.
Consider that the human body is analog and all interfaces with the human body must be analog. The electronics industry uses complex digital chips to solve most problems, and the core of a PG is complex and digital. Whether measured in circuit connections, gates, or functions, the opportunities for failure are far more numerous in the complex core than in the analog shell.
On the other hand, most information arrives at the accessible ports of the device as analog signals. A telemetry channel in most devices can convey encoded digital information to the physician's diagnostic workstation. The information available through telemetry is not direct test information but a functional status that can be used to infer hardware health and commands that can be used to set up a test condition.
In general, the technical challenge is to extract precise information about the health of specific circuits within the PG using the characteristics of analog signals captured by the tester in response to a stimulus. This is not mixed-signal testing in the traditional sense because there is no access to the digital clocks that would enable synchronous sampling. The emphasis is on signal analysis.
An additional challenge is posed by the extreme signal ranges encountered in ICDs. Since these are battery-powered devices that sense human heartbeats, the circuits live on nanoamps and sense microvolts. When called upon to defibrillate a human heart, the output is in kilovolts and amperes. Analyzing these signals calls for precision across a wide range.
Pacing Pulse Analysis
When the heart fails to beat in a timely manner, an implanted pacemaker senses the absence of the millivolt pulse in the electrical field of the heart and issues a trigger pulse to start a beat. The energy delivered in the pacing pulse is programmable to compensate for a number of environmental factors and simultaneously conserve as much precious battery energy as possible.
The characteristics and placement of the wires to the heart and the condition of the heart's nervous system are the largest contributors of variability. A test engineer must determine if the output has an amplitude and pulse width within tolerances of the programmed value.
It is impractical to test every combination of programming parameters, so the test engineer must determine the capability of the circuit to respond to other programmed values. Analyzing the waveform rise time, droop, and recharge pulse amplitude yields values that implicate components in the circuit. If the circuit is correct and at least one set of values corresponds to the programmed intent, the chance of passing a faulty unit is limited to the thoroughness of the control IC test, and that is an industry-standard test.
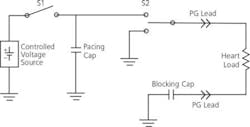
The typical pacing output circuit in Figure 1 shows the components critical to producing the programmed analog output. The controlled voltage source charges a capacitor to the programmed voltage. The control algorithm times the pacing pulse with respect to sensed activity from the heart. To deliver the pulse, S1 is opened, and S2 connects the capacitor to the heart through implanted leads.
Figure 1. Typical Pacing Output Circuit
The characteristic RC discharge is allowed to proceed until the selected pulse width has been achieved. Then the control circuit changes S2 to connect the heart lead to ground. This path discharges the blocking capacitor back through the heart to produce a net zero current flow in the heart. Pacing pulses must be AC with no DC component to discourage long-term electromigration effects in the leads and the cells of the heart.
Analysis of the waveforms shown in Figure 2 provides two kinds of information: numbers that directly relate to component values in the circuit and results that confirm correct control circuit behavior.
Figure 2. Pacing Pulse Waveform
A resistive load is used to simulate the heart and lead system, and the waveform is captured differentially across the terminals of the PG. Timing of the first edge of the first pulse is the reference for analysis. The amplitude of the first pulse must be within the specified tolerance of the programmed amplitude.
Grossly erroneous values signify control failure, for example measuring 6 V rather than 7 V, while small errors such as 7.00 V rather than 7.15 V indicate circuit faults. If a small error is detected, repeated measurements over a programmed range can diagnose a digital-to-analog converter (DAC) linearity issue vs. offsets potentially caused by reference circuits.
Droop in the first pulse amplitude gives the RC value of the two capacitors and the known load resistance. Since the droop of the second pulse provides the RC value of the blocking capacitor and the same load resistance, both capacitor values can be determined accurately.
The pulse width of both pulses and the start timing of the recharge pulse confirm correct control circuit operation. After the waveform is digitized, analysis is accomplished by a National Instruments• LabVIEW program.
Extracting the data from the captured waveforms in a robust manner that gives repeatable results is not trivial. In Figure 2, the typical waveform contains a noise content introduced by fixture wiring, the factory environment, or the PG itself. Sampling used to digitize the waveform during capture can thwart efforts to clearly identify waveform characteristics.
Using curve fitting results in a clean waveform that represents the original with fidelity not afforded by low-pass filtering. Low-pass filtering not only limits the noise, but also rounds off inflection points.
Moving the apparent start of a leading-edge or droop measurement can significantly change the result. Applying curve fitting maintains the sharpness of the inflection points. The heart load is characterized for test purposes at 500 W. Each of the two capacitors is 10 F. The time constant is 2.5 ms, and the pulse droops as e-t/RC.The LabVIEW software converts the droop value of the fitted curve over the pulse width to a capacitance value. A direct reading makes clear diagnostics.
Curve fitting also ensures that the narrow rising and falling edges are represented clearly and that the 50% points can be found even if no sample landed there. Timing of the start of the recharge pulse confirms another portion of the control and starts the calculation of another droop value.
Since S2 has been thrown, the second droop is a discharge of the blocking capacitor through the load without the pacing capacitor connected. This value has a time constant of 5 ms.
The energy under the first pulse must match the energy under the second pulse to make sure there is no DC current component. If the control circuit is working correctly, the second pulse will be stopped only after sufficient discharge has occurred to equal the first pulse's energy with nearly a zero-volt trailing amplitude.
The software can calculate the energy of both pulses and compare the difference to the specification limits. In addition, the software computes the value of the blocking capacitor from the RC value and also can calculate the value of the pacing capacitor.
In a single output event, the main circuit components and the basic control circuit function have been tested. Selecting several extreme cases for amplitude and pulse-width programming provides the data to confirm most of the control circuit's functionality.
Production testing doesn t attempt to verify the design, but possible circuit faults must be checked. For each of several pulses, the difference between the actual and programmed values is captured. The average value of these readings reveals the error in the internal DAC reference. Differences in the values indicate nonlinearity in the DAC, but that characteristic is more thoroughly examined at the component test level and seldom checked as part of the PG test.
ICD Interface Hardware
The challenges of testing buried complexity extend to the hardware realm. An ICD uses a necessarily simple set of heart leads to perform a broad range of functions.
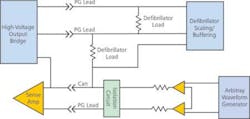
Figure 3 is a simplified diagram of the interface between an ICD under test and the test instruments. Only that portion of the circuit used in the induced-shock test is shown. Accessing the complexity of a full-featured ICD through a handful of leads requires multitasking. The same sets of PG leads with a few auxiliary leads not shown perform tests that source and sense energy at widely disparate levels.
Figure 3. Simplified ICD-to-Test Instrumentation Interface
Sensing tests use the arbitrary waveform generator to provide haversine waverforms that simulate the electrical activity of a heartbeat. To get the most out of instrumentation such as waveform generators and digitizers, the signals should be a significant portion of the 10-V full scale. Differential scaling brings the signal down to microvolts at the PG leads.
External shock tests confirm the capability of the ICD sensing circuitry to function after being subjected to a kilovolt pulse from the test system. This test simulates the application of the emergency-room paddles to a patient who already has an ICD in place. The relays for switching a high-voltage capacitor onto these leads are not shown, but even with the arbitrary waveform generator switched out, the millivolt circuits are only a fraction of a centimeter from the kilovolt shock.
During an induced-shock test, the capability of the ICD to respond to simulated dangerous heart rhythms is tested. A millivolt level input of either fast regular haversine pulses simulating tachycardia or narrowband noise to represent fibrillation is applied across the sense inputs of the ICD.
Its normal response to these types of signals is to charge and fire a 750-V high-energy pulse of 5 ms to 10 ms back into the heart. In this case, the shock is fired into a load in the same interface circuit that provides the sensitive input.
Although the shocking coils are not the same connections as the sense lead, in the hot-can mode of operation they share a common terminal, the ICD case or can. Because the control clocking is buried in the ICD, disconnecting the sensitive circuits just prior to the shock is unreliable. Protection circuits are needed to limit the damaging effects of errant high-energy pulses resulting from either test equipment or ICD malfunction.
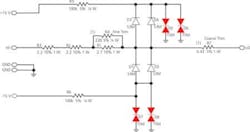
The solution is a set of energy-absorbing circuits set to shunt voltages of more than 16 V quickly while minimally loading the circuit (Figure 4). Shunting is performed by thyristors D5-8. To ensure quick action and minimal capacitive loading, they are held at a bias voltage near their trigger point by supply rails at +15 V and -15 V. The back-biased diodes D1-4 isolate the rails from the circuit under normal conditions and prevent leakage current in the thyristors from loading the signal line.
Figure 4. Energy-Absorbing Circuitry to Protect Implantable Devices Under Test
Kept at the edge of conduction, the thyristors respond in nanoseconds to limit the spike passed into the instrumentation amplifier inputs to a few volts. As the thyristors conduct, the voltage is dropped across resistors R1-4. These protection circuits are applied on sensitive circuits to divert unintentional energy. Without them, the reliability of the interface would be in question after any failure of an ICD under test. A similar but simpler protection circuit is used within the ICD to protect its sensitive input circuits from external defibrillator shocks.
Shocking output pulses are in the kilovolt range and must be scaled by a factor of 100 while being converted from differential to single ended for digitization. Since even leakage currents of less than 1 mA can be harmful to the body, the leakage of high-voltage circuits in the ICD must be accurately assessed when they are in the off state.
Avoiding loading by the parts of the interface not needed in a particular configuration is critical to the accuracy of measurements. Linearity, distortion, differential balance, and guarding for picoamp leakage are the challenges to layout and routing as well as circuit design in the interface.
Summary
Implantable medical devices, particularly pacemakers and ICDs, have become complex devices that use digital control circuits to sense the body's signals and respond with appropriate therapies. Testing that complexity with only a handful of analog access ports meant to connect to the body is a unique challenge.
The physical interface between an ICD and the test system must multiplex sensing and stimulus signals of a wide energy range through common signal lines while preserving accuracy and protecting delicate circuitry. Once the device responses are captured, analysis of waveforms extracts meaningful values that confirm control circuit operation and verify critical component values within the ICD or pacemaker.
Acknowledgement
I am grateful to Jon Fahlstrom, Steve Kalthoff, and Bill Pierson, engineers at Guidant, for their contributions to this article.
About the Author
J. Max Cortner is director of test engineering for the Cardiac Rhythm Management Division at Guidant. Previously, he spent 17 years as a test engineer for Sperry Defense Systems and three years as a field engineer for TSSI. Mr. Cortner holds a B.S.E.E. from Iowa State University and an M.S.E.E. from the University of Minnesota. His technical accomplishments include two test-related patents and a book on digital test engineering. Guidant Cardiac Rhythm Management Division, 4100 Hamline Ave. N, MSE105, St. Paul, MN 55112-5798, 651-582-4317, e-mail: [email protected]


