Fix the Process, Not Just the Product
Understanding your company’s manufacturing process and how to minimize defects has always been important. Today, its importance is increasing with the complexity of products and the customers' demand for higher quality.
Quality management solutions that integrate real-time test and inspection results with engineering and production data can optimize the entire manufacturing process. They enable electronic manufacturers to efficiently deliver products while achieving higher quality, reducing manufacturing costs, and cutting repair time.
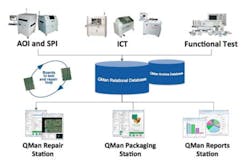
Figure 1 illustrates the cost and time benefits of a quality management system (QMS) when integrated with engineering data and manufacturing processes.
By collecting results from all aspects of test and inspection in a central relational database, failure and measurement data can be used to assess the efficiency of the production process, predict process issues, and create detailed diagnostic information.
Figure 2 shows real examples that can be derived from integrating this data.
Figure 1. QMS Overview
As detailed in many previous studies, defects increase costs and waste valuable resources. These costs increase the later in the process the
defects are found. As a result, tools that can identify the problems quickly and efficiently are critical to today's processes.1
Defects are not always visible during the manufacturing process, so tools that allow defects to be correlated with their manufacturing processes are vital. Not only do manufacturers need feedback from inspection and in-circuit test (ICT), they also would like feedback from functional test. Accordingly, by continuously monitoring all aspects of test and inspection, these goals can be achieved.
Internal or External Quality Management
At Pulse Communications, quality management tools have been deployed since the mid 1990s and focused on optimizing processes. Over that time, test has moved from being an internal process to an external manufacturer. A quality management tool, like QMAN quality management software from Digitaltest, also allows for a seamless migration of test and inspection data.
The test optimization practices at Pulse include a continuous program review to ensure peak efficiency. These improvements also are fully portable and can be implemented on all systems across the company’s standard network. The reason for continuous test optimization is to increase yields, reduce costs, and decrease false calls and escapes on all programs.
Table 1 details a typical report showing the fault distribution across functional and ICT at Pulse Communications’ manufacturing partner. This data can be produced using the time ranges you require and allows you to drill down to the exact cause of a defect (Figure 3).
| Table 1. Table of Defect Causes |
| Figure 3. Defect Classifications across ICT and Functional Test |
Pulse Communications works in a high-mix environment and, since implementation of a QMS, it has been able to use the measurement data to improve the quality of its products. By providing real-time feedback to earlier process steps, QMAN has helped increase first pass yields (FPY) to more than 96%. These tools also have allowed the company to react quickly to problems by providing real-time trend alarms during production (Figure 4).
| Figure 4. Real-Time Trend Alarms |
Defect Classification across All Equipment
Defect classification across all test and inspection equipment allows for correct quality data. In most QMSs, ICT, functional test, and AOI are reviewed by different systems. This causes data inaccuracy. Also, these systems tend to only highlight defects. It takes diagnostics to determine the root cause of these failures. QMAN presents the test engineers with the product data: the product's net list, test results, possible short-circuit locations, the board schematics, and more.
| Figure 5. Repair Workstation |
Successful repair actions from all test and inspection processes then can be automatically added to the fault catalog. The repair workstation (Figure 5) makes the standard repair actions available to optimize the repair time and ensure high-quality repairs.
To allow for inspection integration, the board image is merged with the board layout data. The resulting image/layout offers the repair technician a tool to guarantee a successful repair while reducing repair times.
In addition, the ability to link to the schematics helps engineers backtrack functional defects to their source. This data is tracked for every unit factory-wide, making this information available in real time.
QMAN’s repair tool also provides the capability to reduce operator training at the repair process for ICT and visual inspection. In a study compiled by Flextronics, there is a clear correlation among the skill level of a repair operator, the simplicity of the repair terminal, and the accuracy of the defect classifications.2 The goal of a QMS is to provide actionable, understandable defect information that the operator can determine with minimum training.
In addition, the QMS needs to provide a detailed defects list containing status, part number, reference, and connections. When the unit is scanned by a repair workstation, the board image is displayed with clear indicators where failures are detected. Operators conduct their work and repair defects. No paper, stickers, or markers are needed. Everything is tracked, traced, and controlled to deliver analytical results.
FPY Reports and Pareto Analysis Charts
The American Society for Quality defined first pass yield “… also referred to as the quality rate, [as] the percentage of units that completes a process and meets quality guidelines without being scrapped, rerun, retested, returned, or diverted into an offline repair area. FPY is calculated by dividing the units entering the process minus the defective units by the total number of units entering the process.”
FPY is given by this equation:
FPY = 100 x (NTB – NFB)/NTB
where: NTB = number of tested boards
NFB = number of failed boards
Consequently, an FPY report can be generated (Figure 6).
| Figure 6. FPY Report |
In the Pulse Communications case, FPY problems were quickly visible (Figure 7). The company recently had an example where yields dropped below 50%. By being able to see the real-time alarms from the manufacturer and drill down through the defect data, the QMS allowed an issue with a screen printer to be correctly identified and corrected.
| Figure 7. FPY in 40% to 60% Highlighting a Problem |
The Pareto chart in Figure 8 shows the significance of various factors in the declining order of columns. Pareto charts frequently are used in quality control to exhibit most common causes for failure or product defects. The principle behind the charts is called Pareto 80-20, which states that, for many events, roughly 80% of the most significant effects come from 20% of the reasons.3
| Figure 8. Pareto Analysis Chart of Defect Causes |
Clear presentation of the production progress (Figure 9) for various board lots is an indispensable tool for the managers to keep projects on time and satisfy their customers’ demands.
| Figure 9. Work-in-Progress Report |
Summary
The greatest value of the QMS is in the information it makes available. Being able to get data from all test processes is invaluable. Combining data from inspection, ICT, and functional test allows you to provide the data to drill down to the exact defect/process relationship to quickly fix the process step causing the issue.
The flexibility of the QMS system also is important to the success of implementing a solution, based on several features:
- Links to ICT
- Links to functional test
- Links to inspection and AOI
- Real-time information
- Links across multiple sites
- Statistical and analysis reports to evaluate production quality and frequent-failure sources
QMS tools can empower the people in operations to get manufacturing information in the hands of those who need it while reducing costs and improving quality.
References
1. Davis, B., The Economics of Automatic Testing, 1994. ISBN 0-07-707792-x
2. Mendez, D., “Development of an Integrated Overlapping ICT and X-Ray Inspection Process,” IPC APEX Electronics Assembly Process Conference, 2001.
3. Mohan, R.R., Thiruppathi, K., Venkatraman, R., and Raghuraman, S., “Quality Improvement through First Pass Yield using Statistical Process Control Approach,” Journal of Applied Sciences, 12: 985-991, 2012.


