Machine condition monitoring is a data acquisition application that also involves a degree of analysis and reporting. In addition, the overall process implies an element of time. Straightforward performance testing measures output against a standard—did the engine develop the expected torque at the set rpm? In contrast, condition monitoring compares a succession of measurements taken over time against a baseline or against previous measurements. At one extreme, condition monitoring is looking for a trend that may indicate a need for maintenance. At the other extreme, it’s attempting to avoid catastrophic failure.
Major infrastructure equipment typically comes with built-in condition monitoring. As stated in a recent article, “Condition monitoring of rotating equipment is common throughout the oil and gas industry, with the objective to detect, analyze, and diagnose machinery faults. Critical machines (turbines, compressors, and large motors) are normally equipped with online condition monitoring and protection systems. The balance of plant equipment (motors, pumps, and fans) generally is not.”1
However, as the author points out, the latter category accounts for the majority of both the quantity of equipment and the maintenance costs. The large machines and their monitoring systems are permanently wired—a prohibitively costly undertaking for the many smaller machines. Wireless condition monitoring is becoming a popular alternative because “… it bridges the gap between the cost of a wired system and inefficiencies of portable systems.”1
It’s fair to ask, “What is being monitored?” Of course, measuring the same parameters isn’t applicable in all applications. Nevertheless, temperature and vibration are two variables commonly found in monitoring schemes. According to Bob Judd, director of marketing, United Electronic Industries, “By far, the most common indicator of wear or imminent failure usually is temperature. It seems most things run hot when something’s going wrong. On the more complex side, monitoring vibration in rotating systems also can point out things like worn bearings or loose fittings.”
Judd said that the company’s UEILogger and UEIPAC Cubes were used for machine condition monitoring with the UEIPAC having the advantage of also performing ongoing analysis. Should a parameter be outside the normal range, UEIPAC also can notify the supervisory monitoring station via Ethernet, Wi-Fi, or a cell interface. He said, “The most exciting addition to our health-monitoring line is probably our new UEIPAC 400-MIL. This new chassis is completely sealed and self-contained. It can be mounted in an outdoor or other ‘difficult’ environment without requiring any external packaging or protection.”
Reference 1 is more specific about which parameters are monitored: “The SKF wireless machine condition sensor collects data on three key machine conditions: temperature (indicative of lubrication issues, increased friction, rubbing, etc.); overall machine condition (vibrations caused by misalignment, imbalance, mechanical looseness, etc.); and rolling element bearing condition (allows damage detection and diagnosis of source as ball/roller, cage, inner, or outer raceway).”1
Of the three quantities, rolling element monitoring is the most expensive because of the much higher frequencies involved. As discussed in a report on wind turbine reliability, “Two categories [of vibration monitoring] are used, but both are distinct from the common low-frequency vibration monitoring included in the turbine control and safety systems. The first category uses sensors mounted to the bearing housing or gear case to detect characteristic vibration signatures for each component. The signature for each gear mesh or rolling-element bearing is unique….
“The second category includes the ‘shock-pulse’ or acoustic systems that use high-frequency, narrow-band vibration sensors to detect structure-borne pulses that occur when a rolling contact or gear mesh encounters a discontinuity in the surface, indicative of wear or debris particles. Both systems are component-specific and require a significant investment in up-front engineering time to select the optimum sensor configuration and to develop algorithms for interpreting the data collected from the sensors.”2
Courtesy of LORD MicroStrain Sensing Systems
Application Examples
Heavy Construction Equipment
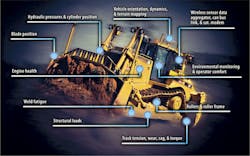
Even with a rigorously enforced daily or weekly greasing schedule, heavy equipment eventually wears out. LORD MicroStrain Sensing Systems’ products include sensors and nodes specifically designed for tracked vehicle health monitoring (Figure 1).
The SG-Link-LXRS wireless, two-channel analog input sensor node operates on the 2.405-GHz to 2.480-GHz band using the direct sequence spread-spectrum technique. Datalogging rates are selectable from 32 Hz to 4,096 Hz for one channel and to 2,048 Hz for two channels.
With one single-ended channel and one differential channel with optional bridge completion circuitry, the node can accept inputs from most types of analog sensors including Wheatstone bridge, vibration, strain, torque, load cells, and pressure. Typically, sensor outputs relate to track tension, the track rollers and roller frame alignment, hydraulic pressures and cylinder position, and general engine health.
Offshore Wind Turbines
Especially given the recent trend toward extremely large turbines with multi-megawatt output, online condition monitoring is a must. And, for this application, the cost and difficulty of access make a wireless approach mandatory. As explained in reference 2, “On-line observation provides deeper insight into how well the turbine subsystems are performing while rotating under load and can alert the maintenance staff to both long-term and short-term events that may not be obvious with a spot check. Second, on-line monitoring can be incorporated into SCADA systems to automatically trigger appropriate alarms and alert staff when a problem occurs. This feature is essential for unattended turbine operation, especially in remote or inaccessible locations.”
As described in a National Instruments case study, Spanish company Fundacion CARTIF developed an online wind farm monitoring system based on NI’s CompactDAQ system that included the NI cDAQ-9172 eight-slot chassis, a USB accelerometer, the NI 9205 C Series analog input module, the NI 9423 sinking digital input module, and the NI 9474 digital output module. Of these modules, the NI 9205 determines the data acquisition performance. It is a 32-channel single-ended or 16-channel differential input unit with a 250-kHz aggregate sampling rate and 16-bit resolution.
The case study claims that a 25-kHz transfer rate was achieved for eight analog channels, so one can assume that the acquired signals had upper frequencies less than 1 kHz. No mention is made of signal conditioning; however, given the 9205’s 370-kHz analog bandwidth, a low-pass filter that removed a decade or two of spectrum below that figure would reduce noise while leaving the actual signal unaffected.
Courtesy of DATAQ Instruments
Punch Press
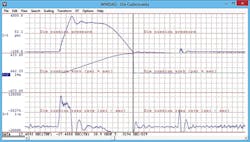
Hydraulic presses used to form sheet metal parts are more complicated than they may appear. A key part of the forming process is the die cushion that helps to control the flow of the metal around the die. Degradation of the die cushion will affect the quality of the parts being produced. As explained by Roger Lockhart, vice president at DATAQ Instruments, “[Figure 2] shows the acquired pressure waveform from the die cushion and integral and derivative pressure waveforms as calculated by DATAQ’s CODAS analysis software.
“Integrated pressure reveals the total work done by the die cushion in units of psi-s. As the cushion wears, the final magnitude of work performed by the device will decay to a threshold value that flags the need for replacement or maintenance. The current peak work in this example is approximately 600 psi-s…. The calculated pressure derivative is interpreted as ramp rate and gives a sense of the level of abuse applied to the die cushion.” He concluded, “The current peak value is >105,000 psi/s, and the measure often is used as a design parameter to ensure that normal press operation does not subject the die cushion to undue stress.”
Appropriate Instrumentation
Lockhart recommended the company’s Model DI-718B DAQ system with isolated 8B amplifiers as a good solution for many condition-monitoring problems. The DI-718B has a maximum throughput rate of 4,800 Hz and a 2-kbit sample buffer. More than 50 types of single-channel 8B amplifiers are available with 240-V input protection, 500-V channel-to-channel isolation, and 1,000-V input-to-output isolation. These specifications are among the factors that distinguish DAQ systems that are well suited to an industrial environment from those that are more at home in a lab.
At the 2014 Autotest Symposium, ADLINK Technology demonstrated the recently released USB-2405 dynamic signal analyzer (DSA) module together with Visual Signal DAQ Express software. The DSA features four channels with simultaneous 24-bit sampling at up to 128 kS/s. A built-in anti-alias filter, a 100-dB dynamic range, and low temperature drift ensure data fidelity.
The free software package performs unit conversion, FFT and IFT transforms, short-term FFT time-frequency analysis, and several types of filtering. Selectable displays include the input signals for each channel, X-Y plots of the signals, and time-frequency representations of the data. A functional-block library provides analysis elements that you string together to create the required multitask analysis without any programming.
VTI Instruments expanded its participation in areas outside of electrical test by purchasing Agilent Technologies’ mechanical test business unit in 2003. A series of product developments since then has culminated in today’s EMX DSAs that feature FPGA-based synthetic instrumentation customization, corporate-wide cloud data management, embedded self-calibration, and precision distributed measurement synchronization. This is not the type of instrument that you would build into an application. Rather, you would use a DSA to troubleshoot problems identified by an online monitoring system but beyond its capability to analyze.
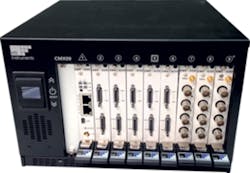
The PXIe EMX-4350 DSA module has four channels with differential IEPE or voltage input, a 625-kS/s simultaneous sampling rate, and 24-bit resolution. The typical dynamic range is 120 dBfs including spurs and harmonic distortion, and channel-to channel phase is matched within ±0.01 degree. The module has input ranges of 100 mV, 1 V, 10 V, and 20 V but can be used with a range of signal-conditioning modules to provide high isolation.
Courtesy of VTI Instruments
Courtesy of Stanford Research Systems
Using the EMX-4350 in the CMX09 chassis, as shown in Figure 3, has the added advantages of chassis temperature, fan speed, and power rail level feedback as well as the capability to inhibit the fan in very sensitive applications.
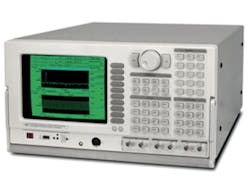
Stanford Research Systems’ SR785 DSA, shown in Figure 4, is a traditional two-channel bench instrument with 100-kHz bandwidth, 90-dB dynamic range, and many built-in analysis capabilities that modular instruments provide in software. For example, order tracking uses multiples of a machine’s basic rotation speed instead of frequency when displaying a spectrum—signal values are displayed vs. order. This analysis tool is popular with automotive noise/vibration/harshness engineers because it helps identify the root cause of what otherwise might appear to be random vibration.
As explained in the SR785 datasheet, waterfall displays are a convenient way to view a time history of your data. Each successive measurement record is plotted along the Z axis, making it easy to see trends in the data. While not an analysis algorithm, waterfall plots help you gain insight into a problem.
NI provides two software packages that support analysis of machine condition-related data. The Sound and Vibration Toolkit includes FFT and transient analysis; acoustic, audio, and vibration measurements; and a few specialized plot capabilities such as waterfall. The Sound and Vibration Measurement Suite is more comprehensive, adding order analysis and extending the toolkit’s capabilities in most other areas.
VTI provides the MAYA HTT Test for I-DEAS sound and vibration software suites at several levels. The Advanced Signal Processing package is compatible with the company’s EMX instruments and includes both order tracking and transient analysis as well as basic core functions.
Further Thoughts
Machine condition monitoring simply makes sense. Studies have shown that performing maintenance at prescribed intervals is wasteful because the machine may not need it at that time. And, there could be a very good reason to inspect the machine a week earlier, but scheduled maintenance would have missed the opportunity to stop a small problem from getting bigger. Another alternative—just running equipment until it breaks—can incur very high costs at inconvenient times. Machine condition monitoring alerts operators to impending problems, allowing replacement parts to be procured and maintenance planned with minimal disruption.
Built-in data acquisition instrumentation accommodates the machine’s basic health indicators, but in all except the most expensive machines, the test equipment’s cost and size limit its capabilities. Most machines won’t have separate high-frequency accelerometer channels associated with each gearbox bearing, for example. When a more obscure or higher speed problem occurs that the built-in instrumentation cannot handle, you need to apply some serious test and measurement horsepower.
DSAs have the accuracy, speed, and resolution to guarantee capture of the most elusive signal aberrations. The related analysis routines, whether built-in as in the SR785 or as separate software suites, support a wide range of techniques as well as display modes. And, using a DSA during the design of a machine can verify the choice of monitored variables assigned to the built-in DAQ system.
References
- Herzog, M., “Analyzing wireless machine condition monitoring for offshore applications,” OE Digital, July 1, 2014.
- Walford, C., Wind Turbine Reliability: Understanding and Minimizing Wind Turbine Operation and Maintenance Costs, Sandia National Laboratories, Report SAND2006-1100, 2006.
For more information
DATAQ Instruments
Fundacion CARTIF
LORD MicroStrain Sensing Systems
National Instruments
SKF
Stanford Research Systems
United Electronic Industries
VTI Instruments


