Techniques to characterize signal-integrity problems quickly and accurately
In today’s high-speed digital designs, signal-integrity issues such as reflections, excessive losses, and crosstalk can degrade system performance. There are techniques through the use of time-domain reflection (TDR) and transmission (TDT) in both simulations and measurements that help engineers characterize and troubleshoot signal-integrity issues with greater measurement accuracy:
- performing TDR/TDT simulations,
- utilizing true short open load through (SOLT) calibration, and
- automatic fixture removal (AFR) for simple and accurate error correction.
Performing TDR/TDT simulations
Solving the simulation to measurement correlation challenge is a significant issue for many designers and can be even more challenging in high-speed digital designs. It is possible to get your measurement simulations to match final results out to 40 GHz—it just takes a methodical approach to understand what is happening in your design.
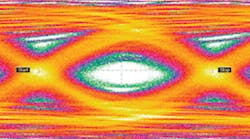
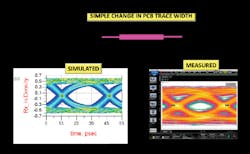
Using a simple printed circuit board (PCB) structure, we can verify correct measurement calibrations and verify the correct simulation setup. It is important that the PCB structure has a series-resonant impedance discontinuity to provide both loss and reflections at high frequencies. The ultimate goal is to have the eye diagram that we simulate match what we measure—and to understand which is correct when they don’t (Figure 1).
The biggest issue is the fixture that is required to get to the DUT structure on the PCB. Going from a NIST-traceable calibration on a coaxial connector to the planar PCB transmission line creates loss. The assumption is you could simply go with a low-loss fixture, make it short, and put the connector as close to the resonant PCB structure as possible. However, reflections will occur. As frequency increases, reflections from the impedance discontinuities between this connector fixture and the DUT start to appear. Simply shortening the path can actually make the magnitude of the impedance reflections larger. To alleviate this, one technique is to take the calibration at the coaxial connector reference plane and move it to the planar environment of the PCB at a location next to the DUT.
The measurement reference plane is moved onto the PCB by mathematically de-embedding the fixture S-parameters. The fixture S-parameters can be measured by taking the fixture we want to remove and mirror-imaging it to create a back-to-back fixture called a 2x through. The measurement of this 2x through then is mathematically split in half using AFR to get the fixture S-parameters for de-embedding.
Within your simulation tool you can create a schematic where the fixture S-parameter (the characterization for the coaxial connector to planar PCB fixture) can be de-embedded from the full path measurement. Note that when you’re doing de-embedding, it is easy to get the wrong fixture model or get the ports mixed up. One of the easiest ways to verify that you have the correct fixture before you de-embed is to overlay the TDR plot of the fixture S-parameter with the TDR plot of the full-path DUT S-parameter measurement. The impedance discontinuities vs. distance need to match for the length of the fixture—otherwise, the whole S-parameter de-embedding will not work correctly.
The verified fixture S-parameters can be de-embedded from the full-path measurement to obtain just the PCB DUT structure; however, there’s another great trick you can do to validate and gain confidence with both simulations and measurements. You can do the reverse and embed the fixture with the simulation of the DUT. The schematic in Figure 2 shows how the fixture S-parameters are embedded into a simple transmission-line model of the resonant PCB structure. Embedding the fixture in the simulation matches the actual full path used in measuring the DUT. The resulting simulated eye diagram in Figure 2 now shows a high degree of correlation with the measured eye diagram in Figure 1. This confirms the significance of the fixture losses at higher frequencies when matching simulations with measurements for multigigabit systems.
Figure 2. Simulation schematic and resulting eye diagram for the full-path measurement fixture embedded with the PCB stripline series-impedance discontinuity
Utilizing true SOLT TDR calibration
TDR calibration removes the effects of fixtures and nonideal instrument performance from the measurement. Things such as imperfect source match and/or step fidelity of the TDR step generator, nonideal frequency response of the TDR receiver, and loss and skew of fixtures can be removed or minimized with a robust TDR calibration process. It is important to note that TDR calibration is not always required, such as when you’re debugging or making quick measurements. However, when you need to accurately characterize a device to generate accurate impedance profiles or to characterize fixtures for de-embedding, you should always use calibration.
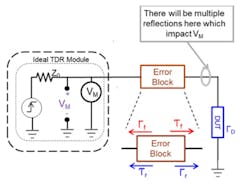
For this analysis, consider the system as a perfect instrument with all the imperfections placed into an error block between the ideal TDR and the DUT (Figure 3). That error block has four coefficients—two transmission and two reflection. The error block impacts signals in both directions: the step going from the TDR to the DUT and the reflection going from the DUT back the TDR. Typically, the impact of the error block on your measurements increases with frequency. To truly remove the effects of the error block and accurately measure the DUT, you must correct for both the forward and reverse transmission and reflection coefficients of the error block.
Taking the simple, single-port case shown in Figure 3, doing the math results in only three unknowns: the forward reflection coefficient (┌f), the reverse reflection coefficient (┌r), and the product of the forward and reverse transmission coefficients (ΤfΤr).
Solving for the three unknowns is accomplished by measuring “standards” such as shorts, opens, and loads that have known performance. Determining ┌f is easily accomplished by measuring a load. Because a perfect load will have no reflection, any reflections measured by the TDR when terminated with a load are caused by ┌f of the error block. Solving for ┌r and ΤfΤr can be challenging. There are a couple of alternatives:
- Use short load through calibration. In this case, you assume ┌r is 0 and measure a short to solve for ΤfΤr. This does not account for the multiple reflections between the error block and DUT. At higher frequencies, this approach is typically not sufficient.
- Use SOLT calibration. This enables you to measure a short and an open resulting in two equations with two unknowns you can use to solve for ┌r and ΤfΤr.
True SOLT TDR calibration provides accurate measurement results but requires time and multiple connections to do correctly. There are electronic calibration modules available that enable you to perform a similar calibration with many fewer steps (for a four-port calibration, only three connections are required instead of 15).
AFR for error correction
The ultimate goal in any measurement is to extract an accurate value of the S-parameters of the DUT with minimum effort and minimum artifacts. The DUT can be measured directly when it is connected directly to the calibration plane. Unfortunately, this is rarely possible. As noted earlier, there usually is some connection or fixture between the calibration plane and the DUT. If we can obtain an accurate description of the S-parameters of the fixture, we can mathematically take the measured composite S-parameters of the DUT and fixtures and extract just the DUT performance.
Historically there have been two methods commonly used to remove the effects of the fixture from the DUT. The first method is to model the fixture using an EM simulator and use the S-parameter results of the simulation to de-embed (remove) the effects of the fixture. It can take much time to create an accurate model for the fixture. Trace dimensions, material properties such as dielectric constant and loss tangent, and 3D models of the coaxial connectors are needed and usually must be refined to get accurate models of the fixtures.
The second technique is to build calibration standards on the same PCB used to fabricate the fixtures since there can be significant variations on board fabrications. There generally are two types of calibration kits that can be created. The first is SOLT as described earlier. The second is through-reflect-line (TRL), which is a calibration technique to move reference planes to the DUT but still requires calibration structures. Until recently, calibration methods only worked with single-ended standards. This means that if there was coupling in the fixture, it was not removed. A recently developed calibration method called differential crosstalk TRL calibration is a differential version of the common single-ended TRL. If there is coupling in these structures, then it is removed in the process of calibration.
The one-port AFR now is the method preferred by most signal-integrity engineers (Figure 4). Instead of building a 2x through fixture, you can simply measure the open or shorted fixture. This simplifies the design cycle, saves manufacturing cost, and speeds time to market. Both the TRL and AFR methods have been shown to work equally well, and the most significant difference is the time savings of AFR. When considering error correction methods, the suggested guideline to assume is that you will see good results up to the frequency point at which the fixture return loss and insertion loss cross.
Conclusion
Over the years, many different approaches have been developed for modeling and removing the effects of the test fixture from the measurement, which fall into two fundamental categories: direct measurement (pre-measurement processing) and de-embedding (post-measurement processing). It is worth considering and reviewing new techniques for both simulations and measurements to characterize and troubleshoot signal integrity issues more quickly.
About the authors
Heidi Barnes is a senior application engineer for high-speed digital applications in the EEsof EDA Group of Keysight Technologies. Her past experience includes six years in signal integrity for ATE test fixtures for Verigy, six years in RF/microwave microcircuit packaging for Agilent Technologies, and 10 years with NASA. Ms. Barnes graduated from the California Institute of Technology in 1986 with a bachelor’s degree in electrical engineering. She has been with Keysight EEsof since 2012.
Jeff Most is a product marketing engineer for Equivalent-Time Sampling Oscilloscopes at the Oscilloscope and Protocol Division of Keysight Technologies. He has a B.S. degree in electrical engineering from the State University of New York at Buffalo and more than 15 years of experience in high-speed communications and signal integrity in various roles at Hewlett-Packard Test and Measurement, Agilent Technologies, and Keysight.
Mike Resso is the signal integrity application scientist in the Component Test Division of Keysight Technologies and has more than 25 years of experience in the test and measurement industry. He has authored over 30 professional publications including a book on signal integrity, been awarded one U.S. patent, and twice received the Agilent “Spark of Insight” Award for his contribution to the company. He received a B.S. degree in electrical and computer engineering from the University of California.


