Make accurate and fast design decisions with data analytics
Data analytics presents design engineers with complete and accurate data to enable new designs to get to market faster.
In an engineering firm, it is a common understanding that the design engineers’ main task is to design the best product and be the first to market. This means working with shorter design cycles and reducing the number of redesigns. The design engineer also will have to deal with engineering resource shortages and budget constraints.
One of the greatest challenges design engineers face is making informed design decisions. This is due to lack of complete and accurate data. The task requires an enormous data-collection and data-analysis effort to gain confidence that the design meets the passing guidelines set by the industry or the company’s own standard for release to production. In some cases, it involves an entire team of engineers and managers from multiple sites.
Today’s design and test flow
Companies often underestimate the enormous complexity in managing and analyzing the data across multiple platforms, groups, sites, or IPs. Ensuring everyone uses the same data format is a pain, especially if multiple engineers from multiple sites are involved. Engineers spend a lot of time working with Excel spreadsheets to create pivot tables to present the data to their managers to facilitate the decision-making process. With different kinds of test environment requirements, designers must spend a lot of time creating different types of filtering in pivot tables to present the data correctly.
The complexity of today’s’ designs with tight margins and more measurement requirements presents a great challenge for these designers to continue to use the legacy method. Lack of visibility and consistency in the way the data is presented can cause them to misinterpret test data, resulting in project delays and increased costs. In addition, when engineers perform IT functions like managing test databases and creating pivot tables, they are not doing the job for which they were hired—to design the best product for their customers.
The data analytics approach
Data analytics is the answer for overcoming these challenges. Setting up data analytics capabilities requires two major components to be successful. The first is a reliable repository to host and secure the data. This can be a cloud, local server, or PC. The second component is a collection of data-visualization tools.
In the test and measurement industry, designers use test equipment and in certain cases automated compliance test to help determine if their design meets the industry criteria for device certifications. For example, high-speed standards like USB, PCIe, and JEDEC for memory devices include published device test specifications and procedures for designers to test against using test equipment like oscilloscopes and bit error rate testers with compliance test software.
Data sources can include results from simulation software, multiple-vendor test equipment, and an individual company’s proprietary measurement tools. Data collected is exported to a data-repository server or cloud, which is accessible by a globally distributed design and validation team. The team from different sites can contribute and retrieve the test results in a standardized format for analysis purposes. They can analyze the measurement results with different properties such as temperature, chip versions, test bench, and others. Data analytics with visualization tools can help make the decision-making process more intuitive and a lot faster. The visualization tools include line and histogram charts with pass/fail limits and statistical information.
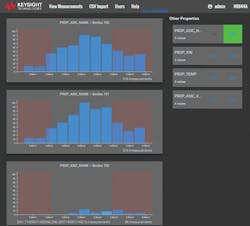
Figure 1 shows an example of a measurement jitter histogram plot of different ASIC names. It reveals that two ASICs, SERDES 700 and SERDES 701, both have the same histogram mode and profile while SERDES 702 doesn’t have enough measurement data to conclude its performance. A manager may want to instruct the team to make more measurements on SERDES 702 before a decision for release to production is made.
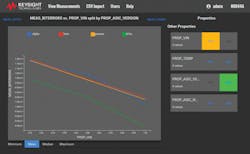
The next plot (Figure 2) is a bit error measurement against input voltage for different ASIC versions. Alpha, beta, and gamma versions have the same bit error measurements while the delta version is performing better with a lower bit error measurement. The team could conclude that the delta version ASIC has better performance compared to the other versions. It also could be that there is discrepancy in the way the measurement is made that causes the outlier behavior. The team also should look at other possible contributing factors such as test equipment, test bench, and the engineer who made the measurements.
Setting up data analytics
The visualization tool is the easy part of setting up data analytics capability. The harder and more challenging part is setting up a web server that would interact with the data repository server for data upload and access. The data repository server must be secured and have the support for backup, restore, and replication. It is highly recommended to have the company’s internal information technology (IT) department’s support in setting up the data repository server.
The web server hosts the data analytics web server application software. It needs to support massive data upload via streaming or bulk transfer. The data also should be accessible in real time. It needs to be operating system-independent. It also needs to be programming language-independent, which means a user should be able to upload data via any data import programming script, such as Python, C#, C++, or Java script. It should use HTTPS for secure data transfer within the company’s network. It must protect the data from any corruption. It also enforces data consistency so that the same kind of format will always be imported to the repository.
It is recommended that the web server and the data repository server be set up using two separate servers to allow for scalability, performance, and data-repository security. The most common data format is .CSV. Users can collect the data in a .CSV file with measurements and properties information. Example of properties are temperature, test-bench names, ASIC names, ASIC versions, and test engineers. Measurements can be jitter, bit error, input voltage, and power.
For most measurements, there are upper and lower limits that would tell the design engineers the margins they have in their design. This can be represented in the histogram and line charts as red zones. All users will need to agree on one syntax for naming properties and measurements to ensure a successful data import.
In summary, design engineers along with their managers need to have confidence that the design meets company or industry standards for release to the market. It is important they create the best product in the shortest design cycles to be the first to market.
Being ahead of the competition and doing it in the most cost-efficient manner have positive business impact. Hence, data-analytics features are designed to work with all measurement data collection methods to allow for simple, quick, nontedious integration into the design and characterization work flow. This would enable all designers to focus on design work instead of spending time on graphing and analyzing test results to facilitate decision-making processes related to the design.
Important data-analytics software features would include a web server application to enable real-time huge data import and access. It also would support visualization tools with different chart options to enable fast and intuitive data analysis for making quick decisions. All these elements should build an infrastructure that would support data analytics successfully in a company.
For further reading
Keysight N8844A Data Analytics Web Service Software, Datasheet, Keysight Technologies, June 19, 2017.
About the author
Ailee Grumbine is strategic product planner, Data Center Industry Solution Team, Keysight Technologies. She specializes in high-speed memory technologies such as DDR and SD UHS interfaces. Grumbine graduated from the University of Science Malaysia in 2001 and completed a Masters of Business Administration at the University of Colorado. Prior to her current position, she was a regional applications engineer.


