Find and eliminate yield limiters with improved diagnosis-driven yield analysis
Diagnosis-driven yield analysis identifies the cause of systematic yield loss to speed yield ramp on new processes and improves yield on mature processes.
Finding the root cause of yield loss is challenging as the number and complexity of design-sensitive defects increases. Yield issues present several bottom-line concerns:
- Missed market windows. Spend months chasing down a root cause of yield loss process and you may very well miss the market window.
- Uncertain circuit reliability. Yield excursions can imply reliability problems. An unstable yield means discarding wafers that don’t meet quality requirements.
- Lost profit. Particularly for high-volume ICs, getting that last 1-2% of mature yield can significantly boost the bottom line.
To help find the location of defects that lead to yield loss, product engineers have typically used scan diagnosis. Once a handful of defective devices was found to represent a yield problem, they could employ diagnosis software to identify the most likely defect locations for these devices. Those likely locations would be further refined through electrical and physical fault isolation prior to construction analysis. However, traditional scan diagnosis is restricted because it lacks a meaningful connection with design layout information.
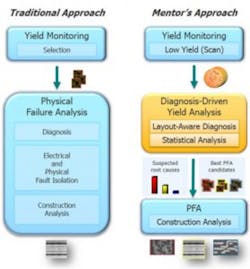
But what if you could improve on scan diagnosis so that rather than just using diagnosis for defect localization, it could be used to determine the underlying root causes and best physical failure analysis (PFA) candidates in a batch such as a wafer or lot of failing devices? This methodology, known as diagnosis-driven yield analysis (DDYA), uses production test results, volume scan diagnosis, and statistical analysis to identify the cause of yield loss prior to failure analysis. This is an improvement in many ways, including improving PFA success, reducing PFA time, finding the root cause much faster, and finding previously hidden yield limiters. An effective DDYA approach (Figure 1) can reduce the time to root cause by 75 to 90%, and identify systematic yield limiters that would otherwise never be found.
Using diagnosis for yield analysis
To make DDYA a reality, there are two key components that need to be in place:
- Diagnosis needs to produce the type of data that is meaningful for yield learning. This involves leveraging layout information like cell type, via type, layer, and critical area. Compared to diagnosis based simply on a logic-only design description (netlist), layout-aware diagnosis improves the diagnosis resolution and provides additional defect classifications. Plus, because as much as 50% of defects in today’s advanced manufacturing processes can be internal to the cells, a transistor-level (Cell-Aware) diagnosis using fault models derived from analog simulation is very beneficial.
- For identification of scan chain defects and chain-functional compound defects, which represent 10 to 30% of logic failures, a DDYA tool should include advanced scan-chain diagnosis. To identify delay defects and timing errors, it should also include an at-speed diagnosis capability. You also need a lot of data to effectively leverage diagnosis for yield analysis, so diagnosis must be run on production test patterns in presence of scan test compression, and with minimum impact on test time.
The analysis of diagnosis results must take the ambiguity of diagnosis results into consideration—this means separating the valuable information from the noise. Two key techniques are zonal analysis, which analyzes the distribution of a defect signature to help spot patterns that point to systematic issues, and root-cause deconvolution (RCD), a statistical enhancement technology that increases the PFA success rate and dramatically reduces the PFA cycle time from months to days (Figure 2). Where layout-aware diagnosis points to a segment, RCD can isolate a particular root cause in that segment.
To help resolve systematic defects that are design-process-related, DDYA can be combined with design profiling as a DFM-aware yield analysis. In DFM-aware yield analysis, the goal is to identify the DFM rules that best describe the actual design-process-induced systematic defects. There have been some challenges in this approach. For example, when you find a defect location that correlates with a DFM violation, how do you know that the violation is the actual cause of the defect? And what if a defect is caused by a design feature that isn’t modeled by the existing DFM rules?
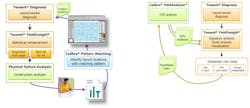
To deal with these situations, you can correlate layout-aware diagnosis data with critical-feature-analysis (CFA) results from a yield analysis tool. If a suspect defect is partially or fully in the same layer and location as a DFM rule violation, this suspect is said to correlate with that DFM rule (Figure 3).
DDYA case study
At the 2012 SEMICON China (CSTIC), Mentor and Freescale described how they enabled mature improvement with DDYA. Freescale had a high-volume design in final production and wanted to improve the yield to realize cost savings. The initial analysis with traditional yield methods showed that the current mature yield loss was caused by random (baseline) defects, and any further analysis would be very time consuming and expensive.
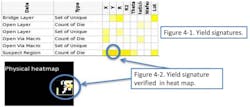
For their DDYA experiment, 1,300 failure files were collected out of several lots of failing devices. (Each failure file represented a scan test failing die). They collected failing cycles and performed volume diagnosis. The diagnosis results were then loaded into Mentor’s Tessent YieldInsight where wafer maps showed a random failure distribution. They selected the remaining logic-only-failure dice (around 700) and analyzed all signatures across all the zonal types. When the analysis was complete, the possible yield signatures were shown in the Tessent tool (Figure 4-1) with different colors. In this case, the “Suspect Region: Count of Die” was flagged as a higher possible yield signature in zonal type Y. It implied that defect locations were sensitive to a specific layout region (Figure 4-2).
There were 30 dice associated with this suspect region. The majority of the failures were due to open layers (including vias) ranging from M1 to M5 based on open layer signature. The wafer map of these 30 dice showed that the top Y region was highly correlated with the hotspot. This information helped guide which die to choose for PFA. The failing information (location along with failing type) was given to the foundry for PFA and there were three PFA hits out of five die total. The foundry made a process correction based on the three PFA results, and as a result, the mature yield was improved by 1.7%, or three times the original goal. All this analysis and process correction was done in a few weeks, which is significantly faster than what could have been achieved without the Tessent tools.
Summary
An effective yield-analysis flow can be realized by combining highly accurate volume scan diagnosis with visualization and statistical analysis. Applying yield analysis based on volume scan diagnosis results that incorporate design layout and failure data, rather than relying on manufacturing process data alone, can reduce the cycle time to finding the root cause of yield loss by 75 to 90%. As designs increase in complexity and process technology advances, the statistical noise reduction of RCD assists in reducing diagnosis noise and cell-aware diagnosis detects transistor-level defects. The DDYA approach can be supplemented with DFM-aware yield analysis to separate design and process related yield limiters.


