Big data maps water content in soil, vegetation phenology
Artificial intelligence has been applied to applications ranging from medical diagnosis to credit monitoring.1 Now the technology is moving further afield—literally. Penn State researchers are employing deep learning to map water content in soil, and a team led by a Northern Arizona University professor uses a vast network of digital cameras to capture millions of images documenting seasonal changes of vegetation across North America.
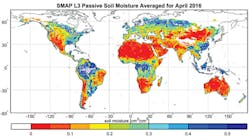
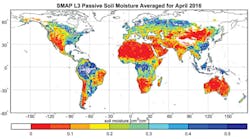
The Penn State researchers make use of data from a NASA satellite called Soil Moisture Active Passive (SMAP), launched in 2015 to measure the soil moisture near the ground surface around the world (Figure 1). But SMAP’s data only goes back two years, severely limiting its use. Consequently, Chaopeng Shen, assistant professor of civil engineering; Daniel Kifer, associate professor in computer science and engineering; and graduate students Kuai Fang and Xiao Yang have employed a deep-learning technology called the Long Short-Term Memory (LSTM) network to extend SMAP’s observations over time.
Courtesy of Kuai Fang
“Currently, if we want to look at the long-term history of how things have changed, we cannot,” Shen said.2 “What this deep-learning method does is it learns the patterns of the past moisture dynamics. We provide the data, such as rainfall precipitation and temperature, in order to train it. Then we are able to take that trained model and run it in a time window where there is no data.”
Vegetation phenology
Vegetation phenology is the subject of a new paper by Northern Arizona University professor Andrew Richardson. Vegetation phenology determines the seasonal events in the life cycle of plants, such as dormancy, budding, leafing, and flowering. Sensitive to climate change, phenology is an indicator for understanding how ecosystem processes are affected by longer growing seasons brought about by warmer climates.
The paper, published in Scientific Data,3 describes a network of more than 400 cameras installed at sites across North America, from Alaska to Florida and from Hawaii to Maine. The network, dubbed PhenoCam—is the result of a 10-year collaboration between Richardson, who led the effort, and scientists from the University of New Hampshire and Boston University to develop a reliable continental-scale observatory of phenological phenomena.
Historically, human observers have measured phenological changes by monitoring individual plants—a labor-intensive approach that resists standardization. However, in 2006, Richardson and colleagues realized the daily pictures they were recording from atop a 90-foot tower at the Bartlett Experimental Forest in New Hampshire could be processed just like the images recorded by satellites, leading to a simple “greenness index”—calculated from the red, green, and blue color information stored in each image—that could be used to track the phenological state of deciduous trees. The greenness index enabled precise identification of the timing of budburst and peak autumn colors.
The paper in Scientific Data is based on images collected through the end of 2015: approximately 15 million images requiring six terabytes of disk space. Over the last two years, the PhenoCam image archive has doubled in size. “Because of the sheer volume of the images we’re capturing, processing, and managing, this project called for a ‘big data’ solution,” said Richardson.4
Richardson—who left Harvard University to join NAU in September—is an ecosystem scientist who splits his time between the School of Informatics, Computing and Cyber Systems (SICCS) and the Center for Ecosystem Science and Society (ECOSS). “One of the reasons I came to NAU was because of the focus on big data, so joining SICCS was exciting for that reason,” Richardson said.
PhenoCam images are available for public use at https://phenocam.sr.unh.edu/webcam/.
References
- Nelson, Rick, “Got credit-card debt? Big data plots risk of default,” EE-Evaluation Engineering Online, March 18, 2015.
- “Deep Learning Technology Helps Researchers Map Soil Water Content Over Time,” Newswise, Feb. 28, 2018.
- Richardson, Andrew D., et al., “Tracking vegetation phenology across diverse North American biomes using PhenoCam imagery,” Scientific Data, March 13, 2018.
- “PhenoCam Network Harnesses ‘Big Data’ to Predict Impact of Warmer Climate on Ecosystem Productivity and Carbon Cycling,” Newswise, March 12, 2018.


