Measuring ACIR of Lithium-Ion Cells
Members can download this article in PDF format.
What you'll learn:
- Specifics on ac resistance and why ACIR has become a standard measurement for Li-ions.
- The 1-kHz test frequency for ACIR and why it's the benchmark frequency.
- Comparing ACIR test vs. electrochemical impedance spectroscopy (EIS).
The internal resistance of lithium-ion cells is an important measurement to make because the cell’s internal resistance can determine the suitability of the cell for a particular application. It can be used as a quality gate in manufacturing, as well as determine the aging or wear out of the cell.
Internal resistance can be measured as ac internal resistance (ACIR) or dc internal resistance (DCIR). Internal resistance also may be extracted from measurement of the cell’s impedance spectrum as captured by electrochemical impedance spectroscopy (EIS) instrumentation.
While ACIR measurements are quite common and somewhat standardized when measuring lithium-ion cells, DCIR measurements are nonstandard and generally misunderstood. DCIR is also sometimes interchangeably called pulse testing, which can lead to further confusion.
In this article, I will focus on ACIR. For more information about DCIR, please take this opportunity to read my article focused on DCIR.
What is ACIR?
To measure ACIR, an ac signal, typically an ac current (Iac), is passed through the cell and the voltage response (Vac) of the cell is measured. The ac current is usually around 100 mA and the frequency is 1000 Hz.
Since the measurement is made with an ac signal, the result is an impedance measurement; to be a resistance measurement, the stimulus would need to be dc. The impedance at 1 kHz is calculated as Vac/Iac. There can be a phase shift between the Iac and Vac when impedance is measured. To keep it simple, the real part (dc) of the impedance Vac/Iac is called ACIR.
It’s unlikely any real-world application of the cell will present a 1-kHz sinusoidal current load on the cell. Therefore, this measurement of ACIR isn’t reflecting how the cell will behave in a real-world application. However, ACIR has become a very standard way of assessing the resistance of the cell, especially when comparing cells to determine which has higher resistance.
Why is 1 kHz Used as the Test Frequency for ACIR?
There are several reasons to use 1 kHz:
- 1 kHz is high enough that low-frequency electrochemical processes are effectively invisible to the measurement, resulting in a measurement that captures the ohmic resistive components.
- 1 kHz is low enough that any parallel capacitance or inductance of the cell, as well as the capacitance and inductance of the test wiring, do not significantly impact the measured resistance value.
- At 1 kHz, the measured resistance values are less dependent on cell state of charge (SoC), or temperature, compared to lower frequencies.
- The instrumentation that makes measurements at 1 kHz is easy to build in an accurate, reliable, and cost-effective manner, compared to instrumentation that operates at lower and higher frequencies.
- Lastly, it is tradition to use 1 kHz, as described in the next section.
History Lesson: ACIR Comes from the LCR Meter
The use of 1 kHz as the ac stimulus signal reverts to the traditional method to measure impedance—the LCR meter. An LCR meter is a type of electronic test instrument used to measure the inductance (L), capacitance (C), and resistance (R) of an electronic component. Since it can measure resistance based on impedance, an LCR meter can therefore be used to measure the ac internal resistance of a cell.
The LCR meter applies a 1-kHz sinusoid current into the cell, and then the meter measures the voltage across the current through the cell. From this ratio, the meter can determine the magnitude of the impedance. Thus, it measures ACIR exactly as a dedicated ACIR measurement instrument, even though the LCR meter can measure more than just ACIR.
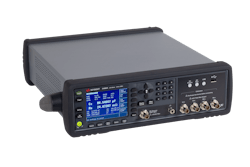
For example, the Keysight E4980A Precision LCR meter (Fig. 1) can be configured to accurately measure the ACIR of the cell under test. The test setup is described in the Keysight Technologies’ Impedance Measurement Handbook.
How Does ACIR Compare to EIS?
Both ACIR and EIS pass an ac current through the cell and the voltage response of the cell is measured. The key difference is that ACIR is completed at 1 kHz and EIS is completed over a wide range of frequencies by sweeping the ac stimulus current from mHz to 30 kHz—or even higher.
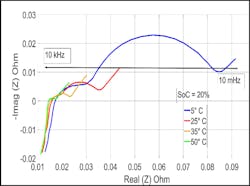
During the sweep, at each frequency, the impedance Z is the ratio of the voltage over current applied to the system Z = V/I and includes magnitude (real) and phase (imaginary). This sweep of data is then plotted using a Nyquist plot, which plots the real value magnitude on the x-axis vs. phase or imaginary on the y-axis (Fig. 2). Interpreting the Nyquist plot requires some physics, intuition, and/or the use of equivalent electric circuits.
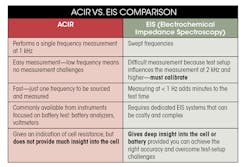
While ACIR looks only at the response of one frequency to determine the internal resistance at that frequency, EIS can reveal much more about the cell being tested (see table below):
- The frequency dependence of the response is used to separate out the different contributions of the cell to allow for independent observations of processes, such as different electrochemical reactions, diffusion of ions within the cell, and material resistance.
- Examine different reaction mechanisms
- Examine electrode process dynamics
- Assess quality and function of separator
- Investigate the solid electrolyte interphase (SEI) behavior
- Identify electrode corrosion state
- Assess SoC by observing shifts in EIS as SoC changes
- Assess cell behavior vs. temperature by observing shifts in EIS as temperature changes


