This file type includes high-resolution graphics and schematics when applicable.
Does the word “jitter” strike fear into your heart? It shouldn’t. While jitter will always be present in your designs, being able to identify causes and sources of jitter will allow you to confidently design and debug your systems.
Essentially, jitter is where your signal’s edges actually are compared to where you want them to be. If your signal’s edges are too far off, it will cause errors in your system. “Total jitter” can be broken down into a number of components that have different root causes with different implications for your designs. Learning the various jitter components and a few key analysis skills (interpreting eye diagrams) is essential when designing and debugging high-speed systems.
Characterizing Jitter
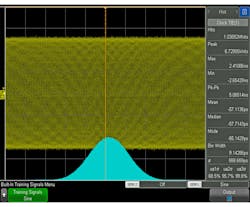
Before discussing how to separate jitter into its components, we’ll first look at how jitter is measured plus a few key terms. Jitter is often visually depicted by a probability distribution function (PDF). The best known example of a PDF is a bell curve, which is the PDF of a Gaussian distribution. On your test-and-measurement equipment, PDFs of a system’s jitter are often called a histogram. Figure 1 shows a jittery signal and its histogram/PDF on a Keysight InfiniiVision 6000 X-Series oscilloscope.
Common jitter measurements include cycle-to-cycle jitter, period jitter, and time-interval error (TIE). Cycle-to-cycle jitter is usually measured as a peak-to-peak value, and is the maximum difference of adjacent clock periods. Period jitter, also usually measured as a peak-to-peak value, is the difference between the longest and shortest clock periods over a specified amount of time. TIE is typically measured as an RMS value, and represents the difference between the ideal clock period and the actual clock period.
Jitter may also be described as bounded or unbounded. Bounded jitter has definite maximum and minimum values, while unbounded jitter has no upper or lower limits.
Finally, many people refer to a “jitter budget.” A jitter budget is the allowable amount of jitter in a system. This design spec is often defined at the beginning of the project.
Components of Jitter
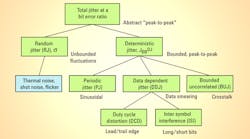
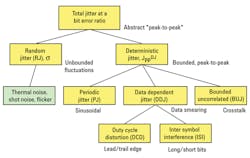
When talking about all of the jitter in a system, we use the term “total jitter” (TJ). Total jitter is made up of “random jitter” (RJ) and “deterministic jitter” (DJ). Figure 2 shows the different components of jitter in the jitter family tree.
Random jitter (RJ)
When talking about random jitter (RJ), we like to use the phrase “jitter happens.” Ultimately RJ is unavoidable, but it can be characterized. RJ has a Gaussian distribution (unbounded) and is caused by a combination of three things:
• First, thermal noise causes random jitter, and is described by Noise = kTB, where k is Boltzmann’s constant, T is the temperature in Kelvin, and B is the system bandwidth.
• Second, shot noise (or Poisson) noise causes RJ. Shot noise is the inherent noise caused by the quantization of electrons and holes, and is influenced by bias currents.
• Finally, RJ is caused by “pink” noise, which is inversely proportional to the frequency (1/f). All systems will have some level of random jitter.
Deterministic jitter (DJ)
Deterministic jitter is non-random, bounded, and caused by systematic occurrences in a design. Furthermore, deterministic jitter can be separated into a number of sub-components: periodic jitter (PJ), data-dependent jitter (DDJ), and bounded uncorrelated jitter (BUJ). Figure 3 shows an example of a system with deterministic jitter. Unlike random jitter, the PDF of deterministic jitter will usually have more than one peak.
Bounded uncorrelated jitter (BUJ)
BUJ can be the most frustrating type of jitter to track down because it’s the least understood in the jitter family. It’s also commonly referred to as crosstalk, but the term “crosstalk” is not exclusive to BUJ. BUJ is considered “uncorrelated” since it’s statistically not possible to correlate it with other parts of the system.
BUJ is caused by system phenomena, though. An example of BUJ would be noise inside a chip caused by sources external to the chip, be it power-rail ripple or RF interference. A number of tools are available to help model crosstalk and identify aggressor signals, but causes of BUJ are generally outside of the designer’s control.
Periodic jitter (PJ)
Periodic jitter can be either correlated or uncorrelated, but is always periodic. A very common source of periodic jitter is a switch-mode power supply coupling into a data or system clock. This would be classified as uncorrelated, because the power supply is not time-correlated with the victim signal. However, if one data signal was coupling in to a data signal based on the same clock, that would be considered correlated.
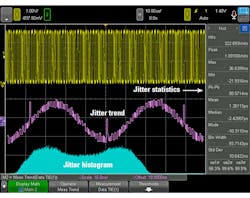
A common way to identify the source of PJ is to use a spectrum view. By plotting a trend of the TIE measurement (i.e., “how far off are my edges, and how does that change over time?”) and then taking an fast Fourier transform (FFT) or frequency measurement of the trend plot, you can see the frequency of the periodic jitter. Figure 3 shows a jittery signal and a plot of the TIE over time. Knowing the frequency of your PJ will be immensely helpful when troubleshooting the aggressor signal.
Data-dependent jitter (DDJ)
Data-dependent jitter can be broken down into two parts—duty-cycle distortion (DCD) and inter-symbol interference (ISI). Both of these components of total jitter depend on the data signals.
• Duty-cycle distortion (DCD): Duty-cycle distortion refers to a system’s tendency to have one bit (0 or 1) with a characteristically longer cycle than the other. This is usually caused by one of two things. The first trigger often involves differing slew rates for rising and falling edges. A slow rising edge could cause a one-to-zero transition to happen slower. The other common cause of DCD is a non-50% threshold level. If the threshold level is too low or too high, one bit will appear to have a longer period than the other. This creates jitter because 0011 will have different edge timings than 0101. The 00 and 11 will not be altered by the differing slew rates, but a 0101 will be affected. In severe cases, DCD can cause a receiver to read an incorrect bit.
• Inter-symbol interference (ISI): Inter-symbol interference, sometimes called “data-dependent jitter,” is caused by long strings of 1s or 0s. By having a long string of 0s or 1s, a settling occurs in the transmitter or physical media. Then, transitioning to the opposite bit can introduce timing inconsistencies. Ultimately, ISI is either caused by bandwidth limitations in the transmitter, receiver, or physical media; or by improper impedance termination. A limited bandwidth will limit the edge speeds; a limited edge speed will cause amplitude variations. Improper termination (or discontinuities in the physical media) will cause signal reflections.
Graphs You Need to Know
Histograms
Histograms display the PDF of your time interval error. Knowing the difference between a histogram showing only random jitter (one peak) or deterministic jitter (multiple peaks) will give you a quick start when tracking down jitter in your system.
Trend measurements
Looking at Figure 3, we see a TIE trend measurement. Because it has a frequency of 20 kHz, there’s likely something in the system running at 20 kHz that’s causing the periodic jitter. In addition, a spike in the trend plot indicates a timing error. This timing error is potentially a result of ISI or DCD.
Eye diagrams
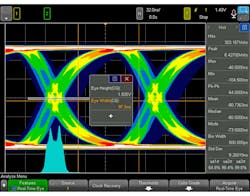
Learning how to read eye diagrams will provide insight into the jitter components at hand. Are there multiple distinct edges, abnormal shapes, varied high/low levels, or non-monotonic edges in your eye diagram? This will help you further analyze what jitter components are the most egregious in your design without having to resort to complex measurements. Figure 4 shows an example of an eye diagram on the InfiniiVision 6000 X-Series oscilloscope.
Bathtub plots
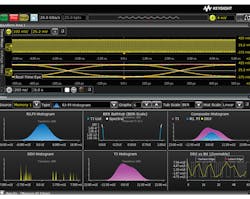
Bathtub plots help you determine your bit error rate (BER) and what portions of the jitter are random or deterministic. Ultimately, when evaluating your design’s jitter budget, the bathtub plot will be helpful for pass/fail analysis and applying confidence intervals to your eye diagrams. An example of a bathtub plot is shown in the middle of Figure 5.
Wrapping Up
Learning the different forms of jitter is just the first step to designing and debugging with a jitter budget in mind. Knowing the different jitter components will become more important as signal speeds get faster and faster. Knowing how to use different graphs and plots to both identify jitter sources and quickly glean necessary information will be a key skill for engineers working with digital systems.
Looking for parts? Go to SourceESB.
