Add Noise Measurements to Your Benchtop Tools
This file type includes high-resolution graphics and schematics when applicable.
The biggest problem with precision noise measurement is that the noise floor you’re trying to evaluate is frequently below the sensitivity of your measuring instruments. The dominant technique for gaging precision op-amp noise is to calculate it from your measurements. A “post-amp” fixture elevates the op-amp noise so it becomes visible with common bench instruments.
Precision op amps, which help facilitate low-level measurements, are increasingly used for sensor signal conditioning in medical applications, IoT sensor circuits, and electronics test instruments. Ideally, you want your amplifier to have a high gain, wide bandwidth, very low input offset, no drift, and no inherent noise. Experienced analog engineers will immediately recognize the tradeoffs—you may not get a high signal bandwidth for precision measurements, and a high gain will likely amplify circuit noise along with the signal you’re trying to capture.
The process for estimating and measuring noise must include all additional circuit components, including the resistors in the circuit. To calculate noise for an op-amp circuit, you need to know the op amp’s voltage noise, current noise density, 1/f corner frequency, frequency range of interest, and all other noise sources (including resistor noise).For precision op-amp applications, you need to eliminate all sources of noise in your circuits. Some of these are subtle; some are obvious. You must remove all sources of electrical interference and construct a well-shielded environment (many vendors recommend a Faraday cage). And you need to use batteries for low-voltage noise sources rather than ripple-prone power supplies. One technique, explained here, uses a “post amplifier” to raise the noise floor of the amplifier you’re testing so that it’s easier to capture with a spectrum analyzer, oscilloscope, or other benchtop instruments.
Voltage-noise density is specified in nV/√Hz (nanovolts per the square root of your measurement frequency, typically 1 kHz), while current-noise density is usually in units of pA/√Hz. Engineers must be sensitive to changes in operating frequency, because the noise content will typically be frequency-dependent. Electrical interference (including motor noise or switching power-supply ripple) will be on the lower end of the frequency spectrum.
On a noise spectrum plot, consequently, there are two distinct regions to consider. One is the high-frequency part of the curve, where noise is intermittent and generally independent of frequency. It will appear to trail off on a noise plot. The other region is the low-frequency part of the curve, which typically encounters frequency-dependent 1/f noise (often called “flicker noise”). The 1/f noise is the minimum level of noise (think of it as “tape hiss” in an audio amplifier circuit). This represents the “noise floor.”
A noise frequency for an op-amp circuit (in RMS) is calculated from the frequency spectrum (the highest frequency measured, the lowest frequency measured), and the flicker noise at the corner frequency. If you want to measure this, the noise output of a circuit is actually referenced to the inputs—it’s the noise you get with the amplifier inputs shorted to ground (through, say, a zero-ohm resistor). To obtain the output-noise level for an op-amp circuit, the amplifier’s input noise is multiplied by the noise gain of a test circuit.
Output Noise = Total Noise × Noise Gain
Raising the noise gain of a test circuit makes the total noise of the op amp under test more accessible to benchtop measurements.
Techniques for Raising the Noise Floor
For a precision op amp, you’re trying to assess frequency-dependent voltage noise and current noise down to 0.1 Hz. You’re looking at measurements on op amps on the order of nanovolts and femtoamps. The problem is that test instruments (like oscilloscopes and digital signal or analog spectrum analyzers) don’t always provide the dynamic range required to measure very small noise levels. You need to reduce the noise of the amplifiers on your test probe, and raise the noise floor of the op amp you’re trying to measure.
Precision op-amp vendors like Texas Instruments provide a variety of hardware and software tools for determining the impact of noise in its application circuits. The “TI Precision Labs—Op Amps” education series, for example, includes nine videos that explain how to predict op amp noise with calculation and simulation, as well how to accurately measure noise.
There are two primary methods for determining DUT op-amp noise, one largely software-dependent and the other more hardware-measurement-oriented:
• In one case, you use a lot of math to cross-correlate random noise and use THAT to mathematically remove correlated noise products. Many precision op-amp vendors offer software for modeling op amp circuit noise.
• In other cases, you actually build the measurement platform—a test fixture whose random noise is effectively 10 dB lower than the device you’re trying to measure.
Leveraging a Post Amp
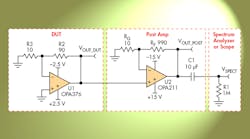
A post-amp reference design can boost the output noise of the device under test (DUT) to allow measurement with standard test equipment. This reference circuit is designed to amplify low-frequency noise (0.1 to 10 Hz) to a level that’s easily measured by an oscilloscope. A high-pass filter in the test circuit cuts everything below 0.1 Hz, while a low-pass filter cuts everything above 10 Hz. The 0.1- to 10-Hz noise measurement is a common figure of merit for precision amplifier datasheets. Figure 1 shows a representative precision amplifier circuit.
Texas Instruments’ OPA376 is used in this example as the device under test, to demonstrate the sensitivity of the fixture. The OPA376 has a low voltage noise on the order of 7.5 nV/√Hz at 1 kHz—0.8 μV p-p from 0.1 Hz to 10 Hz. The gain bandwidth product is wide for precision amplifier (5.5 MHz); its quiescent current is only 760 μA (typical) and its input offset voltage 5 μV (typ.).
With the OPA376’s noise floor being a mere 7.5 nV/√Hz, it’s tough to find a bench instrument to get under that number. You don’t want to lose the measurement on a spectrum analyzer with (say) a 10-nV/√Hz noise floor. A post amp is required to drop lower than that; i.e., amplify the noise floor so that it could be quantified and visualized.
Supporting the post amp is the OPA211, whose own noise floor is 1.1 nV/√Hz. The OPA211 has a wide bandwidth and low noise spectral density. The error from equipment limitations can be significant. For best measurement results, the DUT noise floor should be at least 3X greater than that of the spectrum analyzer.
The design for the post amplifier is similar to the application circuit intended for the DUT. The resistors RF and RG set the gain for the post amp. The gain of the post-amplifier stage will amplify the noise to a level where it’s easily measured by the spectrum analyzer or oscilloscope. In this example, the gain of the post amp is set to 100 V/V for simple scaling. With the gain of the DUT set at 10, the effective noise gain is effectively 1000.
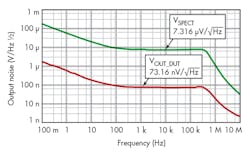
Total contribution of the resistor noise is about 0.4nV/√Hz. That’s small when compared with the OPA211’s voltage noise spectral density, which is twice as great. The output of the DUT is plotted against the output of the post amp (VSPECT) in Figure 2.
If you ground the input of the test fixture (the input signal is zero), your output in principle will be the noise of the device under test—in this case, less than 100 nV/√Hz from 100 Hz to 500 kHz. The spectral density of the output noise (most of it) falls below 100 Hz.


