Compute Low-Frequency Parameters of Resistive Attenuators with Three DC-Resistance Measurements
This file type includes high-resolution graphics and schematics when applicable.
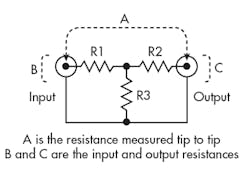
1. This tee-attenuator pad is used for explaining the three-measurement approach and analysis.
While a network analyzer is normally used to measure attenuator characteristics, all low-frequency attenuator parameters may be derived from just three measurements of dc resistance. Figure 1 shows the tee (T) representation of the attenuator; note that the pi (π) representation can also be used, but requires more complex calculations.
First, measure dc resistance between the input and output (A), then between input and common (B) and between output and common (C).
This results in three equations with three unknowns:
Solving for R1, R2, and R3 yields:
The pad attenuation in a system with equal in/out impedances Zo is given by:
The input and output impedances can now be calculated as:
The input and output return losses are given by:
while the input and output SWR is:
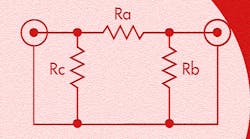
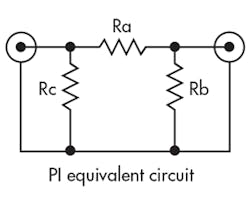
The equivalent pi network can also be calculated (Fig. 2). The equations for this transformation are:
It is interesting to calculate the pad's average impedance Z, based on the measured values of R1, R2, and R3. The average value (R) of R1 and R2 is calculated, forcing the pad to be symmetrical, with identical input and output impedances:
The input resistance of the pad (Z) is calculated as follows, with Z also providing the termination:
Solving for Z and using:
yields this expression for the pad average impedance:
This value should be close to the pad nominal impedance.
Using three DCR measurements makes it possible to calculate all low-frequency parameters of a pad. Minimum-loss L pads will give R1 or R2 equal to zero. These calculations are independent of the internal pad configuration (tee or pi), and also work with cascaded pads.
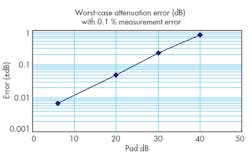
Figure 3 shows the worst-case results of Monte Carlo simulations on pad attenuation with errors of ± 0.1% on the A, B, and C resistance measurements. Simulations of attenuation accuracy, assuming that all DCR measurements have 1% error in the same direction, yields an error of only 0.001 dB.
3. The Monte Carlo simulation of the analysis approach shows the high level of accuracy it yields, even with measurement errors in the same direction.
The author has created an Excel Spreadsheet that does all these calculations, available at: http://ve2azx.net/technical/ResistiveAttenuatorCheckWithanOhmeter.xls.
Jacques Audet received an Electrical Engineering degree from Laval University (Quebec, Canada). His main interests are analog simulation, filters, RF circuits, and antenna experimentation and simulation. Other interests include automated test systems to gather data and process the measured results, as well as developing new test techniques. He can be reached at [email protected].


