This file type includes high-resolution graphics and schematics when applicable.
Almost 10 years out from the 2007-09 sub-prime mortgage financial crisis, the U.S. economy has yet to show a full recovery. For 2015, the economy expanded at a rate of 2.4%, below the average 1947-2016 annual rate of 3.23% according to the U.S. Bureau of Economic Analysis.
China’s slowdown plus weakness in commodity-dependent emerging market economies caused commodity prices to fall. Export shipments weakened due to the strength of the dollar, and after six years of continuous annual gains, the U.S. stock market pretty much flattened out.
In addition, the Fed raised interest rates in December 2015 for the first time in a decade after delaying it from September, if only by a quarter of a point, to fight inflation. The actual effect may have been to slow housing and investment down by increasing the cost of borrowing and further reduce exports by further strengthening the dollar.
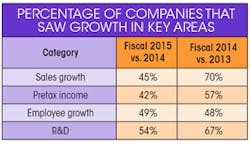
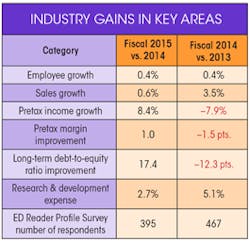
2015 Shows Little Top-Line Movement From 2014
The “Industry Gains in Key Areas” table compares collective data between fiscal 2015 versus 2014 for our current group of 89 companies (for a rundown on how the data was collected, see "Methodology for Determining 2016's Top 50 Employers").
Collective debt-to-equity ratio improvement was significant, too, but it also offset the erosion from last year. However, at 43.9% for fiscal 2015, debt repayment and refinancing should not be an issue as long as the low-interest-rate environment continues and long-term debt can continue to be used to fund growth. If interest rates go up, though, trouble looms.
It appears that fiscal 2015 brought more of the same since the financial crisis of 2007-2009. Some ups, some downs, but no real traction for sustained high growth. We’re at the point where continued productivity gains are becoming elusive. Has the spirit of Moore’s law finally come to an end?
Any gains in corporate profitability are not being passed down to the average worker, with wage increases continuing to be minimal. Employment growth has been encouraging at times, such as the June 2016 growth of 287,000 jobs, but keep in mind that May 2016 saw a jump of only 11,000. And despite the fact that unemployment now sits at 4.9%, a number of the workers who rejoined the full-time work force had to accept substantially lower-paying opportunities and many others have only been able to find part-time work.
While Brexit has brought global interest rates down even lower, the “feel” remains the same: Companies still appear reluctant to invest and the average worker feels like wage increases are almost nonexistent.
The Rest of 2016—Nothing Really New Here
According to the Conference Board, real GDP is expected to grow at 1.9% for the next two quarters and at 1.7% annually for 2016, versus 2.4% in 2015. Real consumer spending at 2.2% for the rest of 2016 implies an annual growth rate of 2.5%, below 2015’s 3.1%. Housing starts should show a 1.7% increase versus 2015 levels, maintaining their positive trend. Net exports continue to decline another 4.3% versus 2015 due to the strong dollar.
Real capital spending will decline by 0.9% versus a 2.8% increase in 2015, largely due to the 6.2% first-quarter decrease. Slow productivity gains are reducing profitability, which is impacting capital investment and wage increases. With sales flat, China’s growth slowing down, Brazil in recession, the uncertainty of Brexit, and more expensive exports, investment has stalled other than for replacement purposes.
Kiplinger’s economic forecast calls for slower job growth for the rest of 2016 despite the strong addition of 287,000 jobs in June, which represented a huge bounce back from just 11,000 new jobs added a month earlier. Monthly job growth is likely to range from 150,000 to 200,000—less than the average 229,000 jobs added per month in 2015.
According to the U.S. Census Bureau’s Retail Trade report, retail sales will increase around 4%, down from 2015’s 4.8% due to lower new car sales. The increase is mainly from online stores (+12.2% in May), as brick-and-mortar department stores continue to struggle (-5.8% in May). Consumers are optimistic but cautious.
None of the above suggests a favorable environment for substantially increased capital spending or consumer spending, which accounts for around 67% of total U.S. economic output, at least not enough to spur significant GDP growth. Thus, 2016 may very well be more of the same.
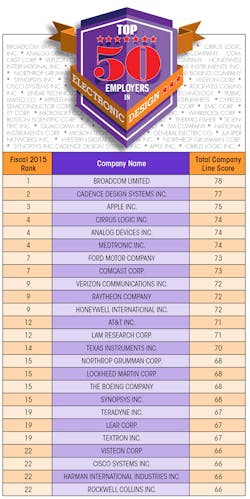
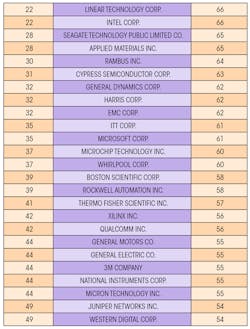
Wired Products Push Broadcom to No. 1
To achieve cost savings by divesting non-core segments, Broadcom and Cypress Semiconductor announced on April 28 the signing of a definitive agreement under which Cypress will acquire Broadcom's wireless Internet of Things (IoT) business and related assets. The all-cash transaction was valued at $550 million.
Broadcom Limited's products cover a wide range of semiconductors. They include chips for wireless and wired communications, as well as optoelectronics, radio-frequency and microwave components, power amplifiers, and application-specific integrated circuits (ASICs, i.e., custom chips). The company's thousands of products are used in myriad applications, including mobile phones, data-networking and telecommunications equipment, consumer appliances, displays, printers, servers and storage networking gear, and factory automation.
The company has four reportable segments: wired infrastructure, wireless communications, enterprise storage, and industrial & other, which align with its principal target markets. Wired infrastructure is by far the largest segment (58% of revenues), followed by wireless communications (22%) and enterprise storage (15%). Positive market trends are driving long-term growth in each of these markets:
Wired infrastructure
• Cloud, social media, and video streaming
• Big data and data analytics
• Rapid evolution of the connected home
Wireless communications
• LTE Advanced/carrier aggregation
• Increasing RF bands per phone
• Mobile connectivity and high-speed Wi-Fi
Enterprise storage
• Data center—higher reach/bandwidth
• Massive growth in cloud storage
• Exponential digital universe growth
Industrial & other
• Increased factory automation
• Energy efficiency/energy conversion
• Emerging markets
Broadcom’s net revenue was $3.5 billion, an increase of 100% from $1.77 billion in the previous quarter and an increase of 119% from $1.6 billion in the same quarter last year. Hock Tan, president and CEO of Broadcom, says, “We delivered solid second-quarter revenue, while exceeding EPS expectations for our first-quarter operating as a combined company. Our increased scale and diversity is already proving very resilient, with strong product cycles in our now largest segment, wired, offsetting weaker demand in our enterprise storage and wireless segments. We are expecting a robust third quarter, led by strong growth in wireless revenue, and continued strength in wired networking, and remain confident in our ability to leverage earnings growth as we work toward full integration and achievement of our operating model.”
Growth is expected to resume in its custom ASIC business, driven by increasing shipments to wireless base stations and a product ramp-up into new data-center switches. AVGO's standard ASSP (application-specific standard parts) switching, routing, and physical-layer products are getting a boost from enterprise demand.
The wireless-communications segment experienced a noticeable slowdown in demand from large North American smartphone customers due to seasonal product lifecycle-related reduction in shipments. This was partially offset by an increasing shipment to a large Asian handset OEM.
The rest of the year should show strong growth in this segment as Apple ramps up for the iPhone 7. Broadcom is already producing RF filters for the phone, which it will start shipping in September with at least 20% content growth in the new model. According to BARRON'S, Taiwan's Economic Daily said on May 23 that Apple had asked its suppliers to produce 72 to 78 million new iPhones by the end of the year, the highest production target in about two years. The expectation had been for 65 million iPhone 7s to be produced this year, so this is good news for Apple suppliers such as Broadcom.
Continued innovations in mobile Wi-Fi and Bluetooth technologies are also a growth contributor. This is important as around 80% of mobile data now moves through Wi-Fi as opposed to LTE.
The company's annual average sales growth over the last five years through both acquisitions and organic growth has been very strong at 27%, and the average EPS growth has also been robust at 24%. Furthermore, average annual estimated EPS growth for the next five years continues to be strong at 18%.
The company achieved 60% gross margins for five consecutive quarters, an impressive accomplishment. In addition, the company’s margins, growth rates, and return on capital have been above the industry median, its sector median, and the S&P 500 median.
IoT Spurs Cadence’s Rise Up the Charts
Cadence’s digital tools automate the design and verification of gigascale, gigahertz SoCs at the latest semiconductor processing nodes. Its IC packaging and PCB tools permit the design of complete boards and subsystems. And a growing portfolio of design IP and verification IP is available for memories, interface protocols, analog/mixed-signal components, and specialized processors.
Customers have included Pegatron, Silicon Labs, and Texas Instruments. Based in San Jose, Calif., Cadence gets about 55% of its sales from customers outside the U.S.
The company is well-positioned to benefit from the IoT, whose technology involves complex circuits. Cadence provides the software that allows its customers to design and produce them.
The value in Cadence's products is that they allow customers to reduce time-to-market for electronic systems and lowers design, development, and manufacturing costs. As an example, Cadence is collaborating with ARM on IoT and wearable devices targeting TSMC's (Taiwan Semiconductor) ultra-low-power technology platform. The collaboration hopes to accelerate development of IoT and wearable devices by optimizing the system integration of ARM IP and Cadence's integrated flow for mixed-signal design and verification, along with its leading low-power design and verification flow.
The partnership will deliver reference designs and physical design knowledge to integrate ARM Cortex processors, ARM CoreLink system IP, and ARM Artisan physical IP, in addition to RF/analog/mixed-signal IP and embedded flash in the Virtuoso-VDI Mixed-Signal Open Access integrated flow for TSMC’s new 55ULP, 40ULP, and 28ULP process technologies. The ULP technology platform is an important development in addressing the IoT’s low-power requirements.
Another example would be the Cadence PSpice Analog/Digital with system simulation and modeling technology that enables a unified design environment for mixed-signal design. A customer can design all three blocks of IoT devices (sensor, controller, and actuator) and simulate the complete system.
As for fiscal Q1 2016 results, total revenues were up 9% year over year in a challenging environment, while pretax income was up 36%. The company’s portfolio of solutions across chip, package, board, systems and software, and IP, guided by their System Design Enablement strategy, position it to drive new business in verticals including automotive, aerospace, medical, and IoT applications.
Strong, broad-based demand for the new Palladium Z1 contributed to Cadence’s best-ever hardware revenue quarter. Rapidly growing complexity and time-to-market requirements make emulation more critical than ever for customers designing chips and systems for mobile, cloud, automotive, and other verticals.
In addition, the acquisition of Rocketick Technologies will significantly increase the performance of Cadence’s incisive enterprise simulator using parallel computing on standard multicore servers.
In IP, the company had a key design win for 5G baseband digital signal processors (DSPs) with a leading mobile handset company. And Spreadtrum licensed the Tensilica HiFi Audio/Voice DSP because of its ultra-low power.
Digital and signoff solutions are also growing, especially with customers in the mobile, consumer, automotive, and IoT segments. In Q1, a leading mobile chip company adopted Cadence’s digital and signoff flow for its most demanding 10-nm projects. The Innovus implementation system added more than 15 new customers in Q1, while the Genus RTL synthesis solution added more than 25 new customers. Taiwan Semi certified its digital and signoff tools for 7-nm design and 10-nm production, and Samsung Foundry certified its tools for its 14LPP process.
Cadence is well-positioned to outgrow its competition and has a very strong, free-cash-flow position.
Apple Still Ranks Third Despite Tough Year
Fiscal Q2 2016 results show that net sales dropped 13% year over year with pretax income decreasing by 24%. Without currency effects, net sales would have decreased 9%.
The most significant factor influencing Apple’s financial results is the iPhone—unit sales of the iPhone were down 16%. For the quarter, iPhone sales represented 65% of net sales, marking the first year-over-year decline for iPhone sales.
While both iPad and Mac unit sales were down 19% and 12%, respectively, for the quarter, these product categories only make up 9% and 10% of net sales, respectively. Services (including revenue from Internet Services, AppleCare, Apple Pay, licensing, and other services), which make up around 12% of net sales, grew at 20%. Other products (including sales of Apple TV, Apple Watch, Beats products, iPod and Apple-branded and third-party accessories) grew at 30% and make up only 4% of net sales.
Without a doubt, the fact that the iPhone 6 and 6 Plus offered larger screen sizes for the first time is a factor in weakening the growth rate of the iPhone 6s. However, according to the latest Consumer Intelligence Research Partners (CIRP) survey, the iPhone refresh cycle appears to be lengthening. In mid-2013, around 33% of iPhones were more than two years old. Currently, that figure is around 50%.
The end of the subsidized phone era by U.S. cellular providers has had an impact on iPhone renewals. In addition, Fortune reported at the end of May that, according to Nikkei Japan, Apple is switching to a three-year new iPhone lifecycle. That would mean only a slight upgrade for the upcoming iPhone 7, thus not making it a “must-have.”
Rumors are also out that Apple would skip the 7s and would go directly to the iPhone 8 in 2017, with purported major form-factor changes such as OLED, no home button, wireless charging, and all glass design. Also, reports from Korea-based news outlets the Korea Herald and Hankyung state that a rumored $2.6 billion deal between Apple and Samsung will have Samsung supply Apple with 100 million OLED panels for the company’s 2017 iPhone version.
As Android phones came into their own around 2013, Apple was able to maintain global market share. In an April report from market-research firm Kantar Worldpanel ComTech, for the three months ended February 2016 versus the three months ended February 2015, Apple has basically been able to maintain its global market share with the exception of a 3-pt. dip in China and a 2-pt. dip in Europe. While Android has increased its market share, for the most part it has come at the expense of Microsoft and other operating systems.
In another report, Kantar reported a 95% loyalty rate for U.S. iPhone owners, the highest ever measured for any smartphone brand. Based on that combination of loyalty and market share, Apple simply dominates industry profitability as the genius is in its marketing. The company’s products are very expensive compared to the competition, with arguably inferior specs, but people still buy them.
A February 2016 Kantar report reveals that Apple accounts for 91% of smartphone profits on around 17% global market share, while Samsung accounts for 14% on around 24% global market share. The data is imperfect, as Chinese manufacturers tend not to disclose profitability, but virtually everyone else lost money, with Microsoft losing the most.
Both the entry-level iPhone SE and the 9.7-in. iPad Pro results were not reflected in fiscal Q2 results, but Apple reports both are selling well. Although the iPhone SE may reduce overall margins, it’s introducing a new customer to the Apple ecosystem.
Apple surpassed an installed device base of over 1 billion in fiscal Q2 2016 between the iPhone, iPad, Mac, Apple Watch, and Apple TV communicating with the App Store and the iCloud. The iOS ecosystem enables the iPhone to protect market share and maintain premium iPhone pricing and strong margins. Once a consumer has spent years in the ecosystem and purchased hundreds of dollars of content, he or she isn’t likely to make the switch to Android and have to rebuild a content library from scratch.
This is the main reason why Apple’s consumer loyalty is so high. Samsung’s Android phones have had better specs than the iPhone for a while now. However, as long as Apple continues to offer a positive user experience, the costs of switching make it too inconvenient and expensive to leave the ecosystem.
If they can also continue to maintain market share in developing markets to take advantage of both population and economic growth, the future still bodes well; if not later this year, then certainly in 2017.
This file type includes high-resolution graphics and schematics when applicable.


