Strain gauge sensors measure the strain (displacement) of an object under an applied force. When they are adhesively attached to the object under stress (an applied force), they deform with the object. The magnitude of the applied stress can be inferred from changes in the gauge’s electrical resistance due to its deformation.
Related Articles
- Sensor Fusion Or Sensor Confusion?
- Power Your Wireless Sensors For 40 Years
- Multi-Variable Sensors Enable Lean Manufacturing
Applications include weigh scales, impact sensors, and medical sensors. They also can be used to monitor changes in the condition of structures such as bridges and of devices such as pneumatic valves. An understanding of how strain gauges are work and how they may be driven helps in achieving precise and accurate measurement results.
Strain Gauge Basics
Strain (ε) is defined as deformation (within elastic limits) of a body under the application of a force. It is a dimensionless quantity and can either be tensile or compressive, depending upon the direction of application of the force (Fig. 1).
In the 17th century, Robert Hooke observed that that, roughly, until displacement reaches an “elastic limit,” the change in displacement is linearly proportional to the force. The material also shrinks on the direction orthogonal to the force. While elongating, the body experiences a perpendicular contraction as well.
This file type includes high resolution graphics and schematics when applicable.
A century or so after Hooke, Siméon Denis Poisson articulated a linear relationship between the stretching and squeezing. Poisson’s ratio is the negative ratio of the elongation strain in the direction of the force to perpendicular compression strain in the axial direction. This leads to today’s strain gauge designs in which the resistive material is applied to the substrate in a serpentine pattern to maximize sensitivity in one direction, namely the one along the axis in which the force is being applied. Such strain gauges have a “gauge factor” (G), which is expressed by:
Signal Conditioning
Although winding the strain gauge resistive material as described above increases the gain factor, the first challenge in interfacing the strain gauge to the electronics still lies in dealing with the relatively small magnitude of the resistance change—that is, a strain gauge’s nominal, unstressed resistance is usually between a few tens of ohms to a few kilohms.
For example, a maximum value of 1 mm of strain together with a gauge factor of 2 gives a resistance change of only 0.2%. This change is very small in the light of the nominal resistance. The typical change can be a few ohms or even less.
In addition to dealing with such low resistance, there may be many sources of errors during the transfer of force to the gauge’s resistance change. Ideally, Hooke’s law would hold, and the force applied should have a proportional increase in the resistance. But this is not the case, due to parasitic factors.
For instance, the lead wires from the strain gauge to the circuit may have a larger resistance than the amount by which the gauge resistance changes. Temperature coefficients of the strain gauge resistance also can be crucial. To compensate for temperature, manufacturers usually compensate for the gauge depending upon the temperature coefficient of the material to which it is tied. While this reduces the thermal sensitivity, it does not completely eliminate it.
Resistive Sensor Readout
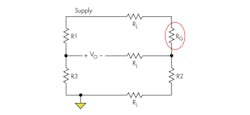
Wheatstone bridge configurations often are used to read out sensor information (Fig. 2). The information from the strain gauge is included in the differential signal (VO):One simple way to measure the strain, known as the quarter bridge method, is to have the strain gauge replace one resistance of the bridge (R1) while the other arm resistance is kept at the nominal resistance of the strain gauge (R3 = Rn). R2 and R4 have the same resistance:
Applying Equation 1 yields:
A very accurate shunt resistance also can be added across the bridge in the quarter bridge circuit. This can be used to calibrate the circuit by measuring the voltage difference with and without shunt resistance to derive the ratio of voltage change to resistance change.
Equation 3 shows that the output voltage depends on a non-linear term. To remove this, a second strain gauge mounted perpendicular to the applied force can replace R3. Temperature affects this gauge in the same way as the primary strain gauge, but the sensing quantity does not.
Going one step forward, we can have an active gauge that is affected in the opposite direction (i.e., its compression rather than elongation), making the output linearly dependent with twice the sensitivity:
This is known as the half bridge method.
Alternatively, all active elements can be included, with each arm having gauges affected by the increase and decrease of the applied force. Also known as the full bridge method, this uses four strain gauges to provide the most sensitive response in terms of magnitude:
When using a full bridge, circuit sensitivity can be maximized by including two gauges in the transverse direction and two in the axial direction of the measurement of force. It should be noted that using four bridges does not increase circuit sensitivity. Therefore, it is not economical to use four gauges. Instead, use two gauges connected in series to make a single quarter bridge.
Error Sources
This analysis assumes ideal components. In real-world applications, resistance tolerances must be addressed. These tolerances saturate the voltage and produce a large common-mode offset since the actual resistance change in the bridge is small. Techniques to overcome these issues include offset-cancellation using auto-zeroing as well as modification to include a balancing circuit to adjust for the tolerances by trimming or calibration.
Another error source arises from the wire resistance connecting the gauge to the bridge that desensitizes the strain gauge measurements. This results in a modified gauge factor, which should be used for correction when calculating the effective force, applied:
The additional resistance causes offset and gain error due to the dependence of lead-wire resistance on temperature.
For making measurements, the bridge is strapped on to the surface of the object to monitor the applied force. The lead wire introduces additional resistance and acts as a source of noise pick-up. Including these in a quarter bridge configuration gives the output voltage as:
Where factor A in the denominator is:
The lead-wire resistance is overcome by using a three-wire connection (Fig 3). Considering R1 = R3 in Figure 3, the resulting strain gauge resistance is:
where RL indicates the wire resistance and supply (VS) is the excitation voltage to the bridge.
The middle resistance, through which no current flows, acts as a sense lead.
For there to be complete compensation in the three-wire configuration, the lead resistances have to be the same, they have to have the same temperature coefficients, and they must be maintained at the same temperature. In reality, this is not true, and more complex schemes use four wires or other offset compensation mechanisms.
Drive Stain Gauges With AC For Digital Readout
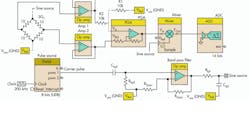
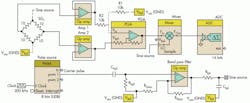
One such compensation technique involves driving the strain gauge with an ac signal, rather than with dc (Fig. 4). The design is implemented with a programmable system-on-chip (SoC). In the circuit, the pulse-width modulation (PWM) generator is used to feed the source excitation signal to the bridge through a band pass filter with a center frequency of 5 kHz.
A programmable SoC allows the filter to be realized using some of the op amps within the device. Chpf and Rhpf control the high pass filter response. Rgain and Rgainf provide the gain. Rlpf and Clpf provide the low pass filtering.
A cascade of these structures provides the required band pass behavior needed to filter the output from the PWM generator so it can be fed to the bridge as an excitation source. An instrumentation amplifier that uses a three-op-amp topology amplifies the signal before it’s down-converted using the mixer and the same sinusoidal signal source.
A sigma-delta converter digitizes the down-converted signal, which includes the sensor information (i.e., difference in node voltages), so the strain gauge bridge output can be read. The sigma-delta converter can achieve up to 20 bits of resolution, depending upon on the sample rate required from the read-out channel.
Umanath R. Kamath is a technical consultant for Cypress Semiconductors. He works on designing and supporting systems around Cypress’ PSoC 1/3 and Power PSoC range of processors. He holds a bachelor’s degree in electronics and communication from the M.S. Ramaiah Institute of Technology, Bangalore. He can be reached at [email protected].


