Speed control of an AC motor requires a three phase supply that can vary both voltage and frequency. Such a supply creates a variable speed rotating field in the stator that allows the rotor to spin at the required speed with low slip. This AC motor drive, or PWM, can efficiently provide full torque from zero speed to full speed, can over speed if necessary, and can, by changing phase rotation, easily provide bi-directional operation of the motor.
Although the principles of PWM drives are not new, advances in power semiconductors, control electronics, and microprocessors have increased their popularity. Adding to this are vector control methods that give the AC drive the capability and flexibility of a full DC motor drive.
PWM MOTOR DRIVES
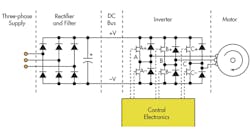
Fig. 1 shows the essential elements of a PWM motor drive. The three-phase sup ply is rectified and filtered to produce a DC bus, which powers the inverter section of the drive. The inverter consists of three pairs of semiconductor switches (MOSFET, GTO, power transistor, IGBT, etc.) with associated diodes. Each pair of switches provides the power output for one phase of the motor. Each pair of semiconductor switches is driven by the control electronics to generate a high frequency square wave carrier pulse waveform at each of the phase outputs.
Since the carrier is identical on all three phases, the net voltage appearing across any phase of the motor windings due to the carrier alone is zero. In order to drive the motor, the control electronics generate three low-frequency sinewaves, 120 degrees apart, which modulate the carrier pulses to each pair of switches. The width of positive and negative pulse within each carrier cycle is modulated according to the amplitude of the low frequency sine waveform of that phase. As a result, the average voltage presented to the motor winding is approximately sinusoidal. The two other phases of the motor winding have similar average voltages spaced 120 degrees apart.
Most PWM drives operate with a fixed carrier frequency that is several times higher than the highest output frequency that is to be used. As industrial drives operate with an output frequency from a few Hertz up to about 100 Hz, they use a carrier frequency in the range of 2 kHz up to about 10 kHz. As power semiconductors improve, the trend is to increase carrier frequencies up to ultrasonic frequencies (> 18 kHz), which can lower losses in the motor since the current is more sinusoidal. The down side is higher switching losses in the inverter and potential for more radiated frequency noise. Thus, careful measurements must be made on drive input and output to make the optimum carrier frequency choice for a given application.
Although the PWM output voltage contains a large number of frequency components other than the fundamental, these components are generally of higher frequency and suppressed by the inductance of the motor winding. However, a motor is not simply an inductor and it is therefore important that the modulation of the carrier frequency be designed to produce a current that is as sinusoidal as possible. In particular, care must be taken to minimize low order harmonic voltages as the impedance of the motor to these voltages is low.
In practice, a drive produces a “wanted” component of current at the fundamental frequency and “unwanted” components of current at frequencies that are multiples or components of the fundamental frequency. The “unwanted” components in the motor current can lead to problems such as additional heat, reduced motor efficiency and lower power output.
The effects of these unwanted components on the operation of the motor can be expressed by measurement of the fundamental and total output power of the inverter, by harmonic analysis of the voltage and current waveforms, and by torque/speed measurements on the motor. The most efficient PWM drives are those that not only minimize losses in the converter, but also generate the most pure current waveforms to minimize power and torque losses.
MOTOR OUTPUT MEASUREMENTS
Motor output measurements can be made by installing speed and torque transducers on the output shaft of the motor to calculate output power. In order to determine the efficiency of a motor and drive combination, the designer must consider both the electrical input to the system, and the mechanical power produced on the output of the motor.
System efficiency is calculated from:
By measuring both the electrical power consumed on the input to the drive, as well as torque and speed on the motor’s output, the efficiency of the system can be measured. The simplest approach to making this measurement is with a power analyzer that includes sensor inputs designed to connect torque and speed transducers.
DRIVE OUTPUT
As noted previously, the output waveform of a PWM drive is very complex, consisting of a mixture of high frequency components due to the carrier and components at low frequency due to the fundamental current. This presents a problem for some power analyzers that can either measure at high frequencies, in which case low frequency information in the waveform is lost, or they can filter the PWM waveform to measure at low frequencies, in which case high frequency data is lost. The difficulty occurs because the waveform is being modulated at low frequency. High frequency measurements, such as total rms voltage or total power must therefore be made at high frequency but over an integral number of cycles of the low frequency component in the output waveform.
The latest power analyzers overcome this problem by using a special operating mode for PWM output measurements. The data is sampled at high speed, and total quantities, including all harmonic and carrier components, are computed in real time. At the same time, the sampled data is digitally filtered to provide low frequency measurements such as fundamental and measurement of output frequency. In addition to providing both low and high frequency results from the same measurement, this technique allows the high frequency measurements to be synchronized to the low frequency signal, providing high frequency measurement results that are both accurate and stable.
To perform a drive output measurement, a power analyzer is wired to the output in a three phase, three-wire configuration. For PWM drives up to 30 A rms output current, the power analyzer can be wired directly into the drive output. For currents above this level, an external shunt or current transducer may be required.
Once the analyzer is connected and configured, also ensure that the correct filter frequency range has been specified. Note that the Vrms, Arms, and Watts figures are measured from pre-filtered values and therefore include all high frequency components, whereas the fundamental values only consider contributions to work in the motor. It is normal to have a significant difference between the rms and fundamental voltage. Normally there is a smaller difference in current and watts because the inductive motor filters the current.
High frequency losses may be estimated by the difference between the total watts and the fundamental watts read on the SUM channel. This represents electrical power delivered by the PWM drive which does not contribute to mechanical output power and therefore adds to the heating of the motor.
High Frequency Losses = Total Watts – Fundamental Watts
This is a useful measurement when comparing PWM drives.
DRIVE DC BUS
Although the link between the input and the output section of the PWM drive is referred to as the DC bus, the voltage and current in this bus are far from pure DC, so care must be taken in making the necessary measurements.
DC bus measurements are best made on the input side of the storage capacitors, since the current here is essentially low-frequency capacitor charging pulses from the AC supply, and free from the high frequency current pulses that may be drawn by the inverter section. If DC bus measurements are made on their own,
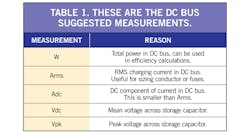
a single channel of analyzer can be used. However, DC bus measurements are often made in conjunction with three-phase two-wire measurements of either the input or output of a drive. In this case the DC bus should be measured using one of the remaining channels operating independently. Suggested DC bus measurements are shown in Table 1.
DRIVE INPUT
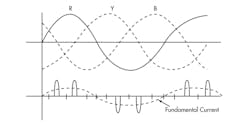
The input circuitry of most PWM motor drives is essentially a three-phase diode rectifier bridge with capacitor filter. The input current to such a circuit consists, on each input phase, of pulses of current that charge the storage capacitor as show in Fig. 2. Input current is therefore a distorted current waveform, with a fundamental component at supply frequency, but with considerable harmonic content.
Input current drawn is essentially independent of the PWM output frequency since the instantaneous power drawn by the drive is a constant, and therefore the current required from the input to charge the capacitor on the DC bus is a constant.
The analyzer is wired to the input in 3-phase 3-wire configuration. In this wiring configuration it is possible to use a third channel of a power analyzer as an independent channel to measure, for example, the DC bus within the PWM drive. If the readings vary too much, for example, when measuring on single-phase drives, increasing averaging may help stabilize the measurements.
LOSS AND EFFICIENCY
On any system, measurements of losses and efficiency are best made by making simultaneous measurements on the input and output of the system. This is particularly important for systems with high efficiency, such as PWM drives. If separate measurements are made on input and output and the system is shut down between measurements to transfer instrumentation, one cannot always be certain that exactly the same load conditions exist for both measurements. Any unnoticed difference in load conditions will appear as an error in measured losses.
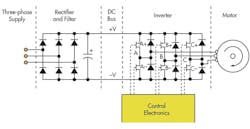
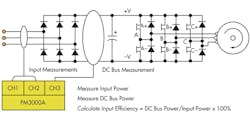
The following method is effective for making measurements of drive efficiency and drive losses using a single power analyzer (Fig. 3).
Step 1 - Measure input efficiency
Example:
Input Power = 1030 W
DC Bus Power = 997 W
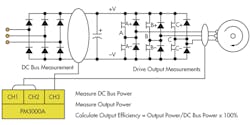
Step 2 - Measure output efficiency.
Conditions should be similar to load conditions in step 1 but need not be identical (Fig. 4).
Example:
DC Bus Power = 973 W
Output Power = 916 W
Step 3 - Calculate overall efficiency and losses.
Example:
If we now wish to determine total losses.
Losses = Input power – Output power
Example:
Using these steps ensures accurate loss and efficiency measurements even though conditions may have changed slightly between input and output measurements. Slight change of condition does not matter as each individual efficiency measurement is made using simultaneous measurements.
The output waveform of a PWM drive is very complex, consisting of a mixture of high frequency components due to the carrier and components at low frequency due to the fundamental current. This presents a problem for some power analyzers that can either measure at high frequencies or they can filter the PWM waveform to measure at low frequencies. Modern power analyzer overcome this problem with a dedicated PWM mode that combines sampling and filtering to provide accurate measurements including input, outputs and efficiency.
