Work/Life Balance Key to Job Satisfaction
Engineers remain broadly happy with their careers, with more than 85% reporting being somewhat or very satisfied with their jobs according to responses to EE-Evaluation Engineering’s 2013 salary survey. That level of satisfaction mirrors the level reported by respondents to the 2012 salary survey.1 Salary remains a key component of job satisfaction among 2013 respondents, but issues such as work/life balance and job security rank high as well.
The average salary this year stood at $99,558, up from $96,915 last year. Unfortunately, not all respondents benefitted. Said one, who wished to remain anonymous, “Salary percentage increase? Get real! You need to add a section entitled ‘salary percentage decrease’ to this survey. My salary went DOWN 5%. Guess how happy I am with the federal government.”
Of course, there is more to work than salary. As Rick Allison of Enercon Engineering put it, “I have been blessed by working with and for electrical engineers who not only provided answers but also the reasons/basis for the answers. This mentoring has provided me the opportunity to learn and become a productive engineer and programmer in our industry.” And he recognizes the need to give back. “It also obligates me to share the knowledge I’ve gained with less experienced and potential engineers,” he said.
And Aaron Miller of Ford Motor Company also sounded an optimistic note, saying, “The industry is doing well at this time. Our company is hiring engineers like crazy. Older engineers like myself have to constantly train to keep on the cutting edge because the new kids are so smart and capable. It is very challenging, but we are up to it.”
Location and Industry
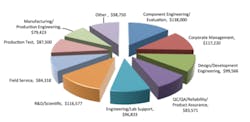
By location (Figure 1), respondents in the Pacific region reported the highest salaries at $113,875. Respondents from the Southeast indicated the lowest salaries at $82,143. With respect to job function (Figure 2), component engineers (although a small sample) did well at $138,000, as did corporate managers and those involved in R&D. Field service engineers came in fairly low at $84,318, although one respondent cited a need for more such personnel.
Figure 1. Average Salary by Region
Figure 2. Average Salary by Job Function
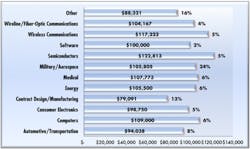
By industry (Figure 3), those in the semiconductor segment reported highest average salaries at $122,813. Respondents in the wireless industry fared next best at $117,222, followed by those in the computer, medical, military/aerospace, and energy fields.
Figure 3. Average Salary by Industry
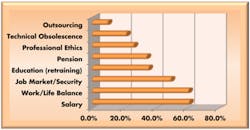
Across industries, salary ranked as the number 1 concern (Figure 4) for readers, with 61.4% listing it as one of three important issues. Salary was followed closely by work/life balance at 60.8%. (Last year, work/life balance won out over salary 64.2% to 63.8%.) Nearly half of the 2013 respondents listed job security, yet only 9.9% reported fearing outsourcing.
Figure 4. Important Issues
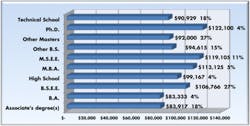
Salaries roughly tracked education (Figure 5), with respondents holding Ph.D. degrees reporting the highest salaries at $122,100. Those with M.S.E.E. degrees came next at $119,105, followed by those with M.B.A.s at $113,125, and B.S.E.E. degrees at $106,766. Those with bachelor’s or master’s degrees in fields other than electrical engineering did not fare as well.
Figure 5. Average Salary by Education
Gaining Expertise
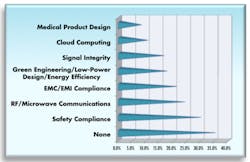
More than a third of the respondents (35.1%) were able to rely on their existing knowledge to perform their jobs—they reported not acquiring any additional expertise over the past year (Figure 6). That figure is down slightly from last year’s 36.7%. Those who did gain additional expertise acquired it in the areas of safety and compliance (29.8%), RF/microwave communications (24%), EMC/EMI compliance (21.1%), green engineering/low-power design (17.5%), signal integrity (16.4%), cloud computing (10.5%), and medical product design (8.2%).
Figure 6. Additional Expertise Acquired over the Past Year
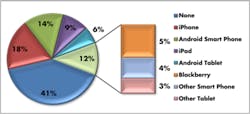
As for last year, nearly half (48%) of the respondents don’t use a smart mobile device on the job (Figure 7). Of those that do, an iPhone is the top choice at 21.6%, followed by an Android phone at 17%. A few readers are making use of iPads (11.1%) and Android tablets (7%). Fewer yet are still using BlackBerry devices (6.4%).
Figure 7. Mobile Device Usage
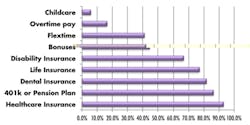
Not surprisingly, most readers (93%) receive health insurance as part of their compensation (Figure 8), and 86.5% participate in a 401k or pension plan. Less than half (44.4%) get bonuses and very few (5.8%) childcare.
Figure 8. Percent Receiving Benefits
Satisfaction and Security
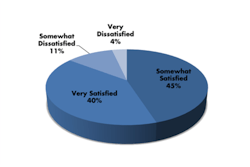
Although individual respondents have indicated some complaints and concerns, respondents remained broadly satisfied with their jobs (Figure 9); only 11.1% reported being somewhat dissatisfied, with 3.5% claiming to be very dissatisfied. An anonymous responder in the latter category reported, “I have worked for a company that has changed ownership six times in 30 years. By far, we are now under the worst possible ownership of all, and that is with one of the previous owners being a corporate raider. Our company has no sense of customer satisfaction, employee satisfaction, or corporate ethics when money vs. rule-bending occurs.”
Figure 9. Level of Job Satisfaction
Another dissatisfied respondent said, “Our large corporate culture has become obsessed with process and schedule to placate Wall Street demands. This change in culture tends to stifle experimentation and creativity. I am no longer satisfied with engineering as a career choice.” Yet another hinted at the changing nature of the engineering profession: “Technical people can’t fix things anymore—it’s ‘change out the boards.’ They don’t know how to troubleshoot—they don’t think.”
And one respondent cited long-term deterioration in the job market, noting significant cuts in pay and bonuses over the past dozen years, adding, “There is a tremendous disconnect between profits and people, and this must be addressed by the government because the owners/board/stockholders do not care about people.”
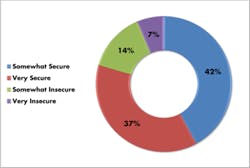
Nevertheless, a large majority (79.5%) feel somewhat or very secure in their positions (Figure 10). Only 6.4% reported feeling very insecure. One respondent did indicate some trepidation: “I am concerned about achieving the sales growth to sustain the staffing increases we have made over the last two years. As a nonunion shop, I would expect the more expensive, older engineers will be released when goals are not met.”
Figure 10. Job Security
Yet another responded, “I’ve been seeking other employment. Unfortunately, most companies want a ‘perfect’ fit for their needs here in central Ohio. I am also older and am not sure if that has made a difference.”
On a more upbeat note, Allan Guida of Linearizer Technology said, “Engineering mathematics entertains me, so I enjoy my work.” And others are adapting to changing career structures. Said Jim Spangler of Spangler Prototype, “I worked for a major semiconductor manufacturer for 25 years. I was laid off in 2009 and have been self-employed since. I do have a pension. I do not want to become an employee of another company. I enjoy my flexible hours and time.”
Several respondents cited concerns about the future of the profession. Said one, who wished to remain anonymous, “The industry needs vibrant new engineers to secure our country’s role in new technologies.” Concluded another, “We need to get more students interested in engineering in the school systems. It is our responsibility!”
Reference
Nelson, R., “Engineers Just Want to Have Fun,” EE-Evaluation Engineering, August 2012, p. 18.


